Publications
ORCID | Google ScholarTable of Contents
- 14 October 2024 - Semisynthetic Simulation for Microbiome Data Analysis
- 17 May 2024 - Data Science Principles for Interpretable and Explainable AI
- 30 March 2024 - multimedia: Multimodal Mediation Analysis of Microbiome Data
- 29 November 2023 - MolPad: An R-Shiny Package for Cluster Co-Expression Analysis in Longitudinal Microbiomics
- 10 June 2023 - mbtransfer: Microbiome Intervention Analysis using Transfer Functions and Mirror Statistics
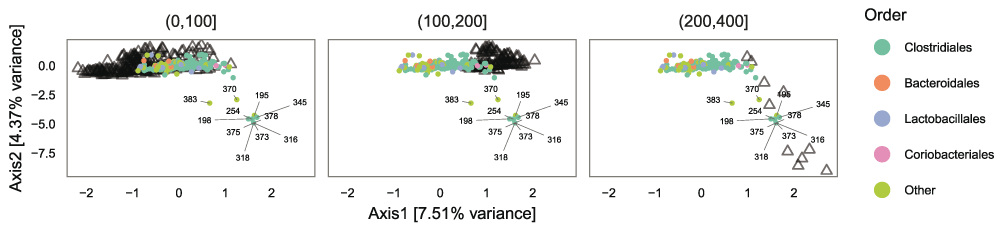
- 10 October 2022 - Microbiome composition modulates secondary metabolism in a multispecies bacterial community
- 11 August 2022 - Generative Models: An Interdisciplinary Perspective
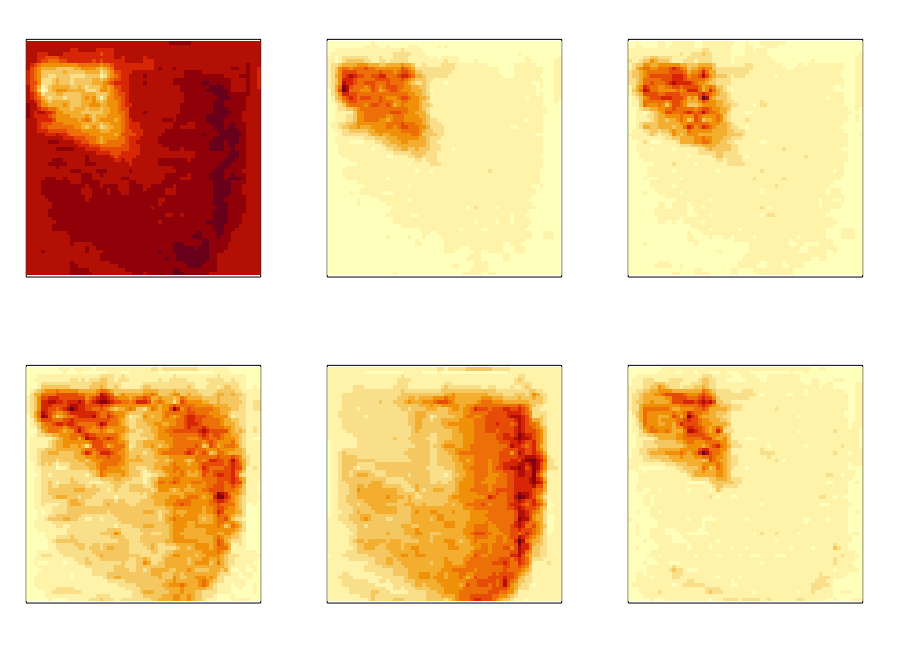
- 19 May 2022 - Spatial Transcriptomics Dimensionality Reduction using Wavelet Bases
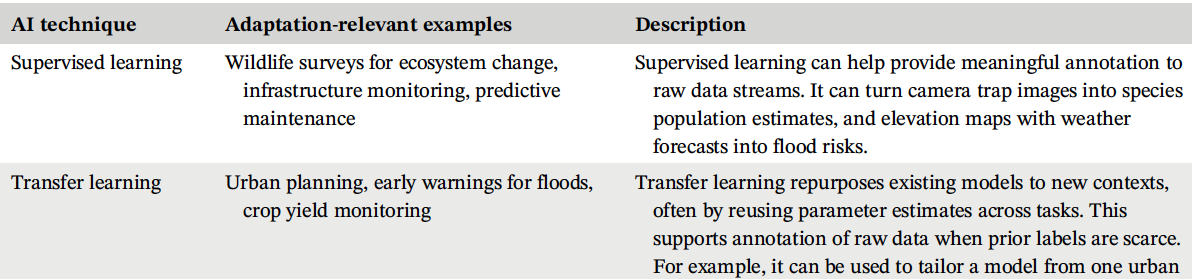
- 21 March 2022 - Artificial Intelligence for Climate Change Adaptation
- 04 February 2022 - Source Data Selection for Out-of-Domain Generalization
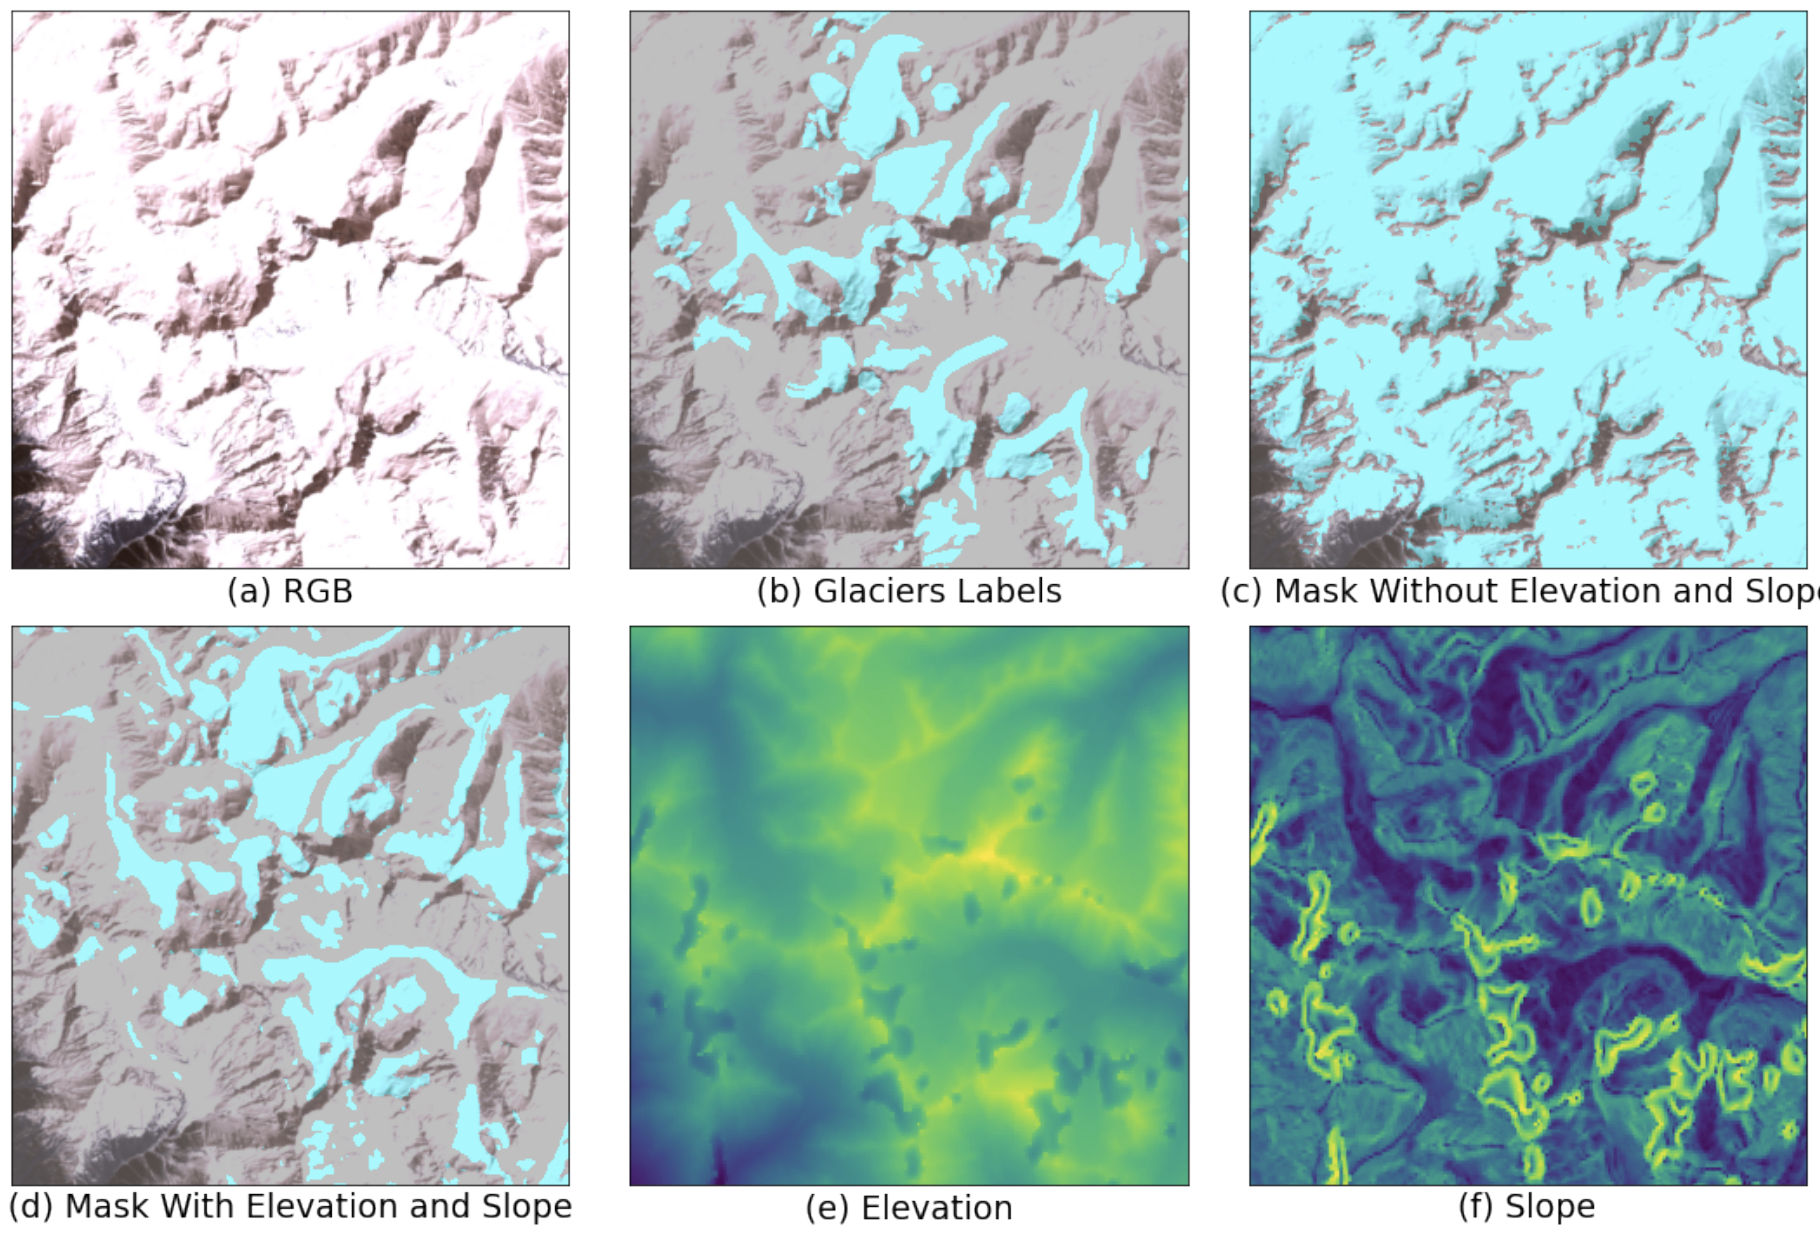
- 31 December 2021 - Estimating Glacial Lake Trends using Historically Guided Segmentation Models
- 11 December 2021 - Interactive Visualization and Representation Analysis Applied to Glacier Segmentation
- 02 December 2021 - Interactive Visualization of Spatial Omics Neighborhoods
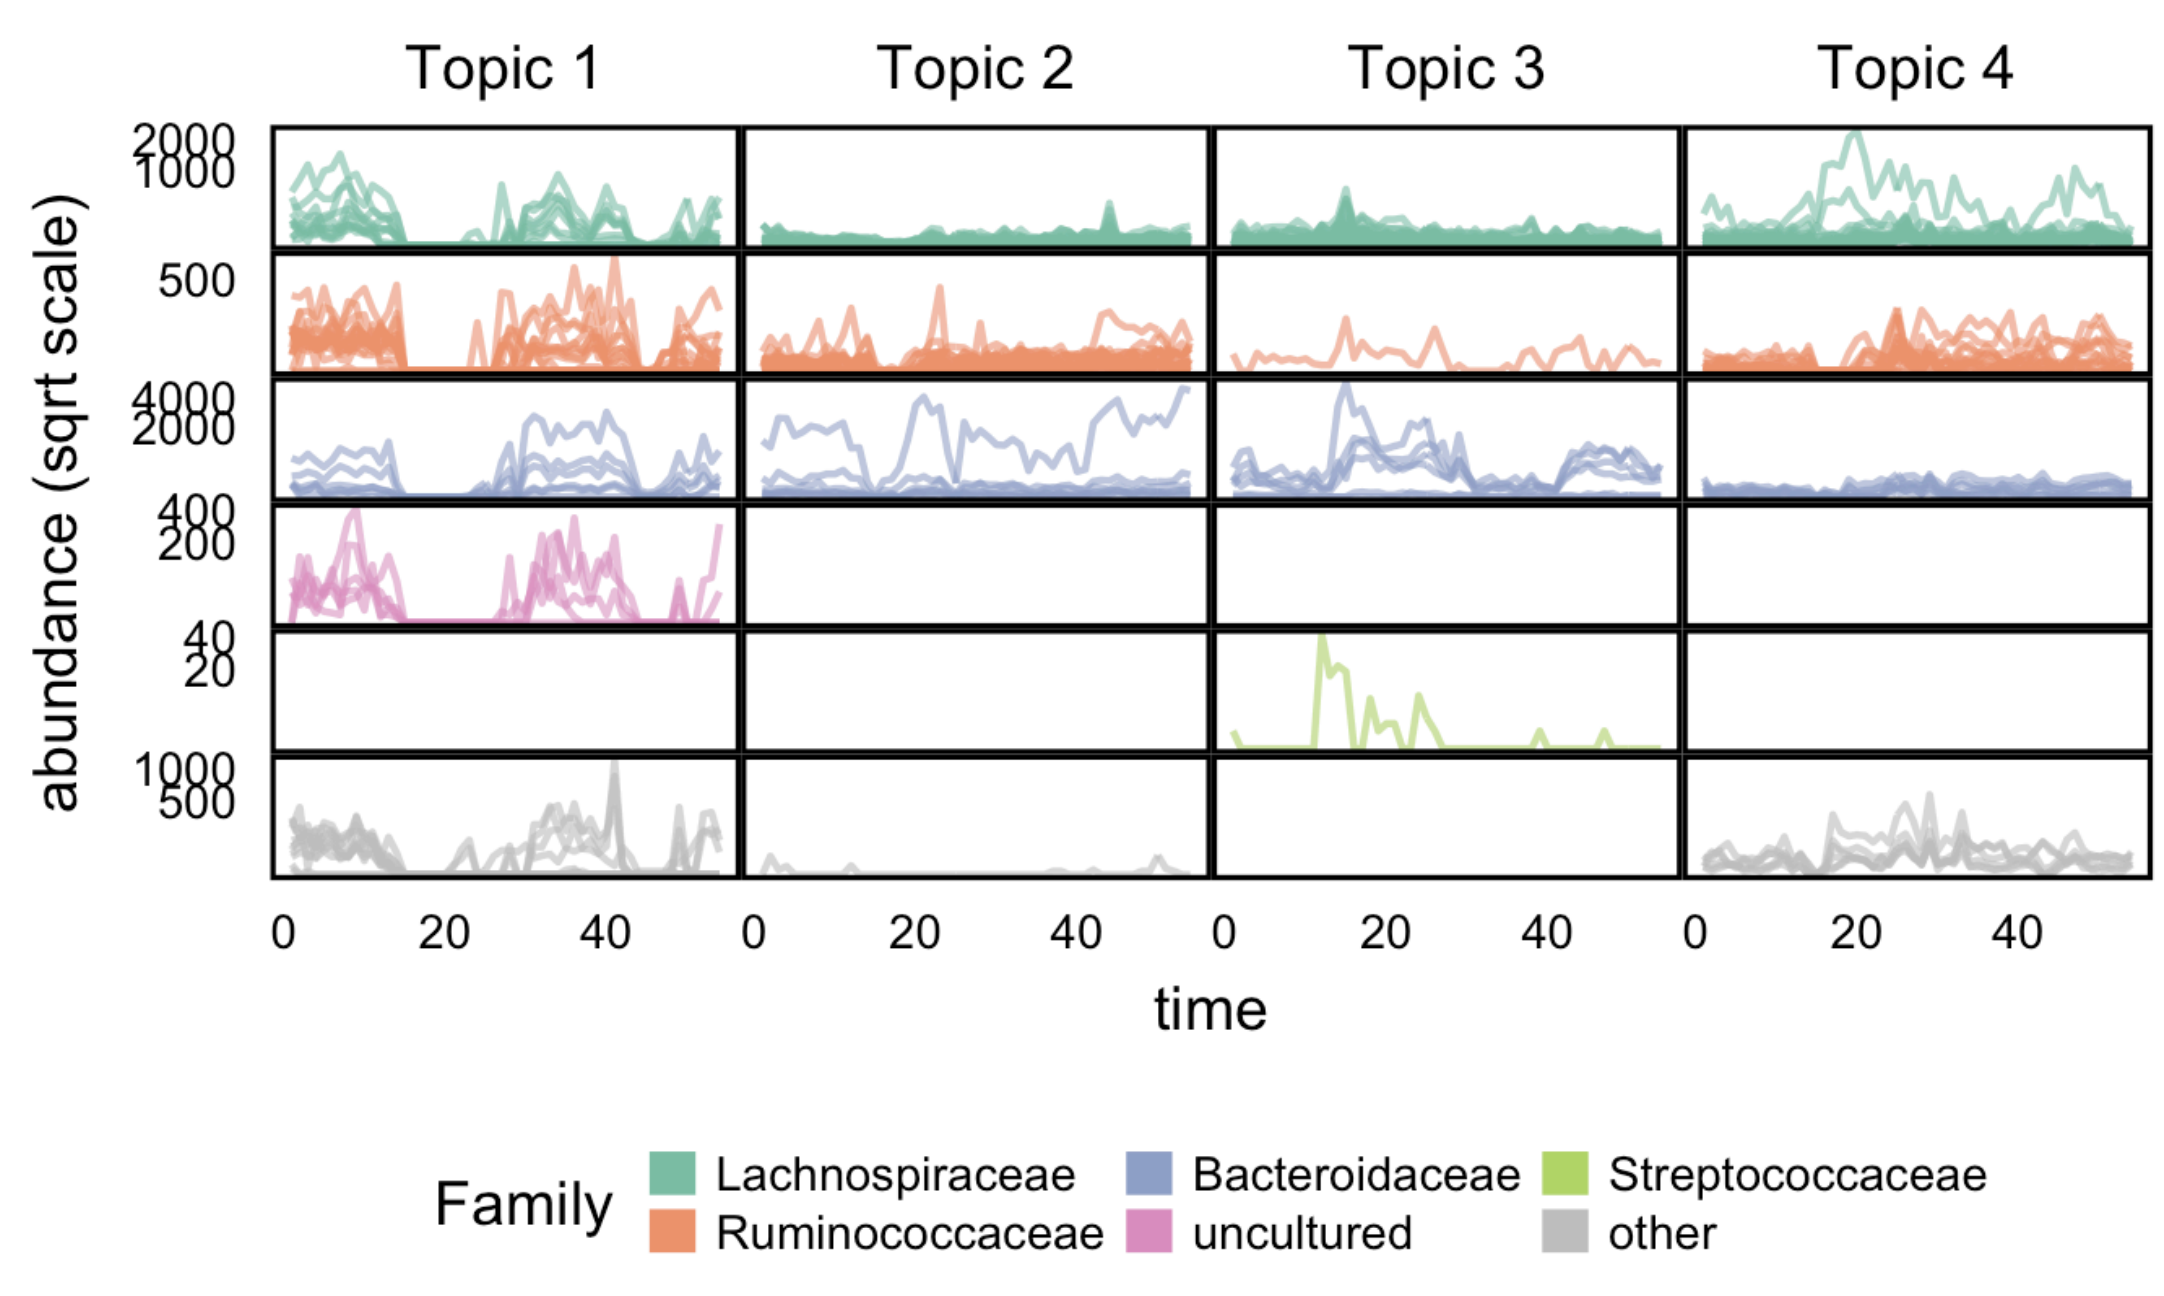
- 10 September 2021 - Multiscale Analysis of Count Data through Topic Alignment
- 20 February 2021 - Bootstrap Confidence Regions for Learned Feature Embeddings
- 09 December 2020 - Machine Learning for Glacier Monitoring in the Hindu Kush Himalaya
- 05 November 2019 - Tackling Climate Change with Machine Learning
- 01 October 2019 - Latent Variable Modeling for the Microbiome
- 29 August 2019 - Multitable Methods for Microbiome Data Integration
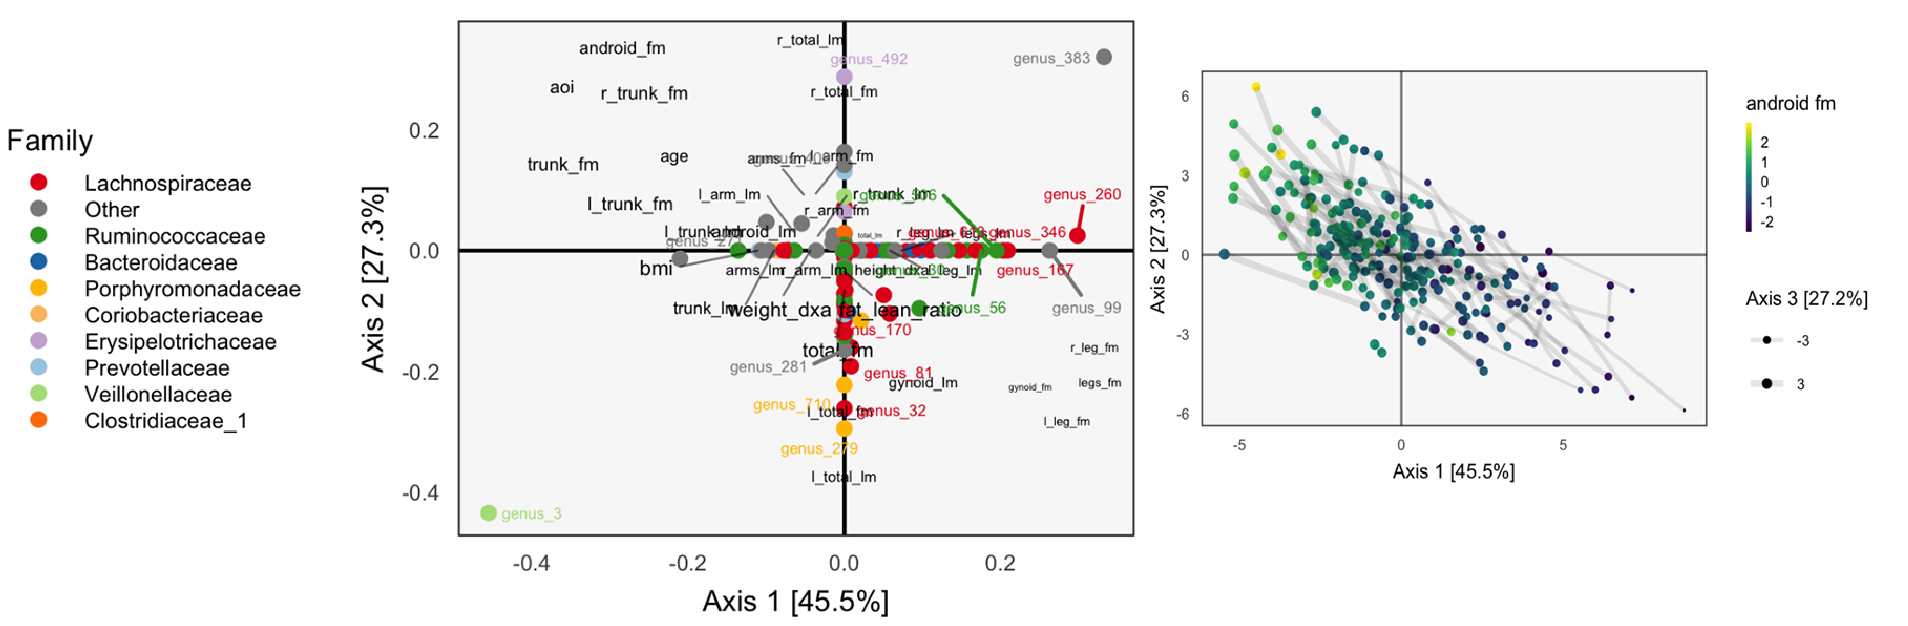
- 03 June 2019 - Sex-specific Association between Gut Microbiome and Fat Distribution
- 08 October 2017 - Interactive Visualization of Hierarchically Structured Data
- 02 November 2016 - Bioconductor Workflow for Microbiome Data Analysis - from raw reads to community analyses
Semisynthetic Simulation for Microbiome Data Analysis
Kris Sankaran, Saritha Kodikara, Jingyi Jessica Li, Kim-Anh Lê Cao
Paper: Under Review | PDF
Code:
Data Science Principles for Interpretable and Explainable AI
Kris Sankaran
Paper: Journal of Data Science | PDF
Code:
multimedia: Multimodal Mediation Analysis of Microbiome Data
Hanying Jiang, Xinran Miao, Margaret W. Thairu, Mara Beebe, Dan W. Grupe, Richard J. Davidson, Jo Handelsman, and Kris Sankaran
Paper: Under Review | PDF
Code:
MolPad: An R-Shiny Package for Cluster Co-Expression Analysis in Longitudinal Microbiomics
Kaiyan Ma, Margaret W. Thairu, and Kris Sankaran
Paper: Under Review | PDF
Code:
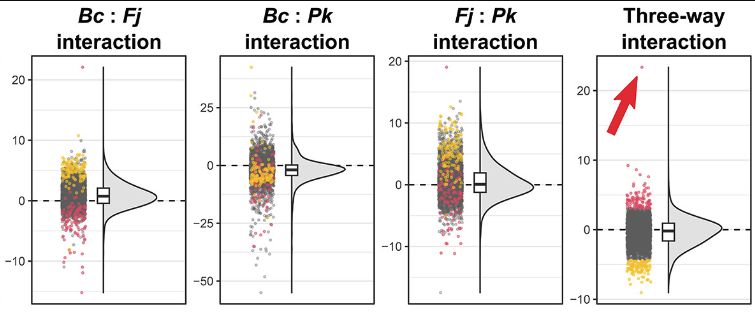
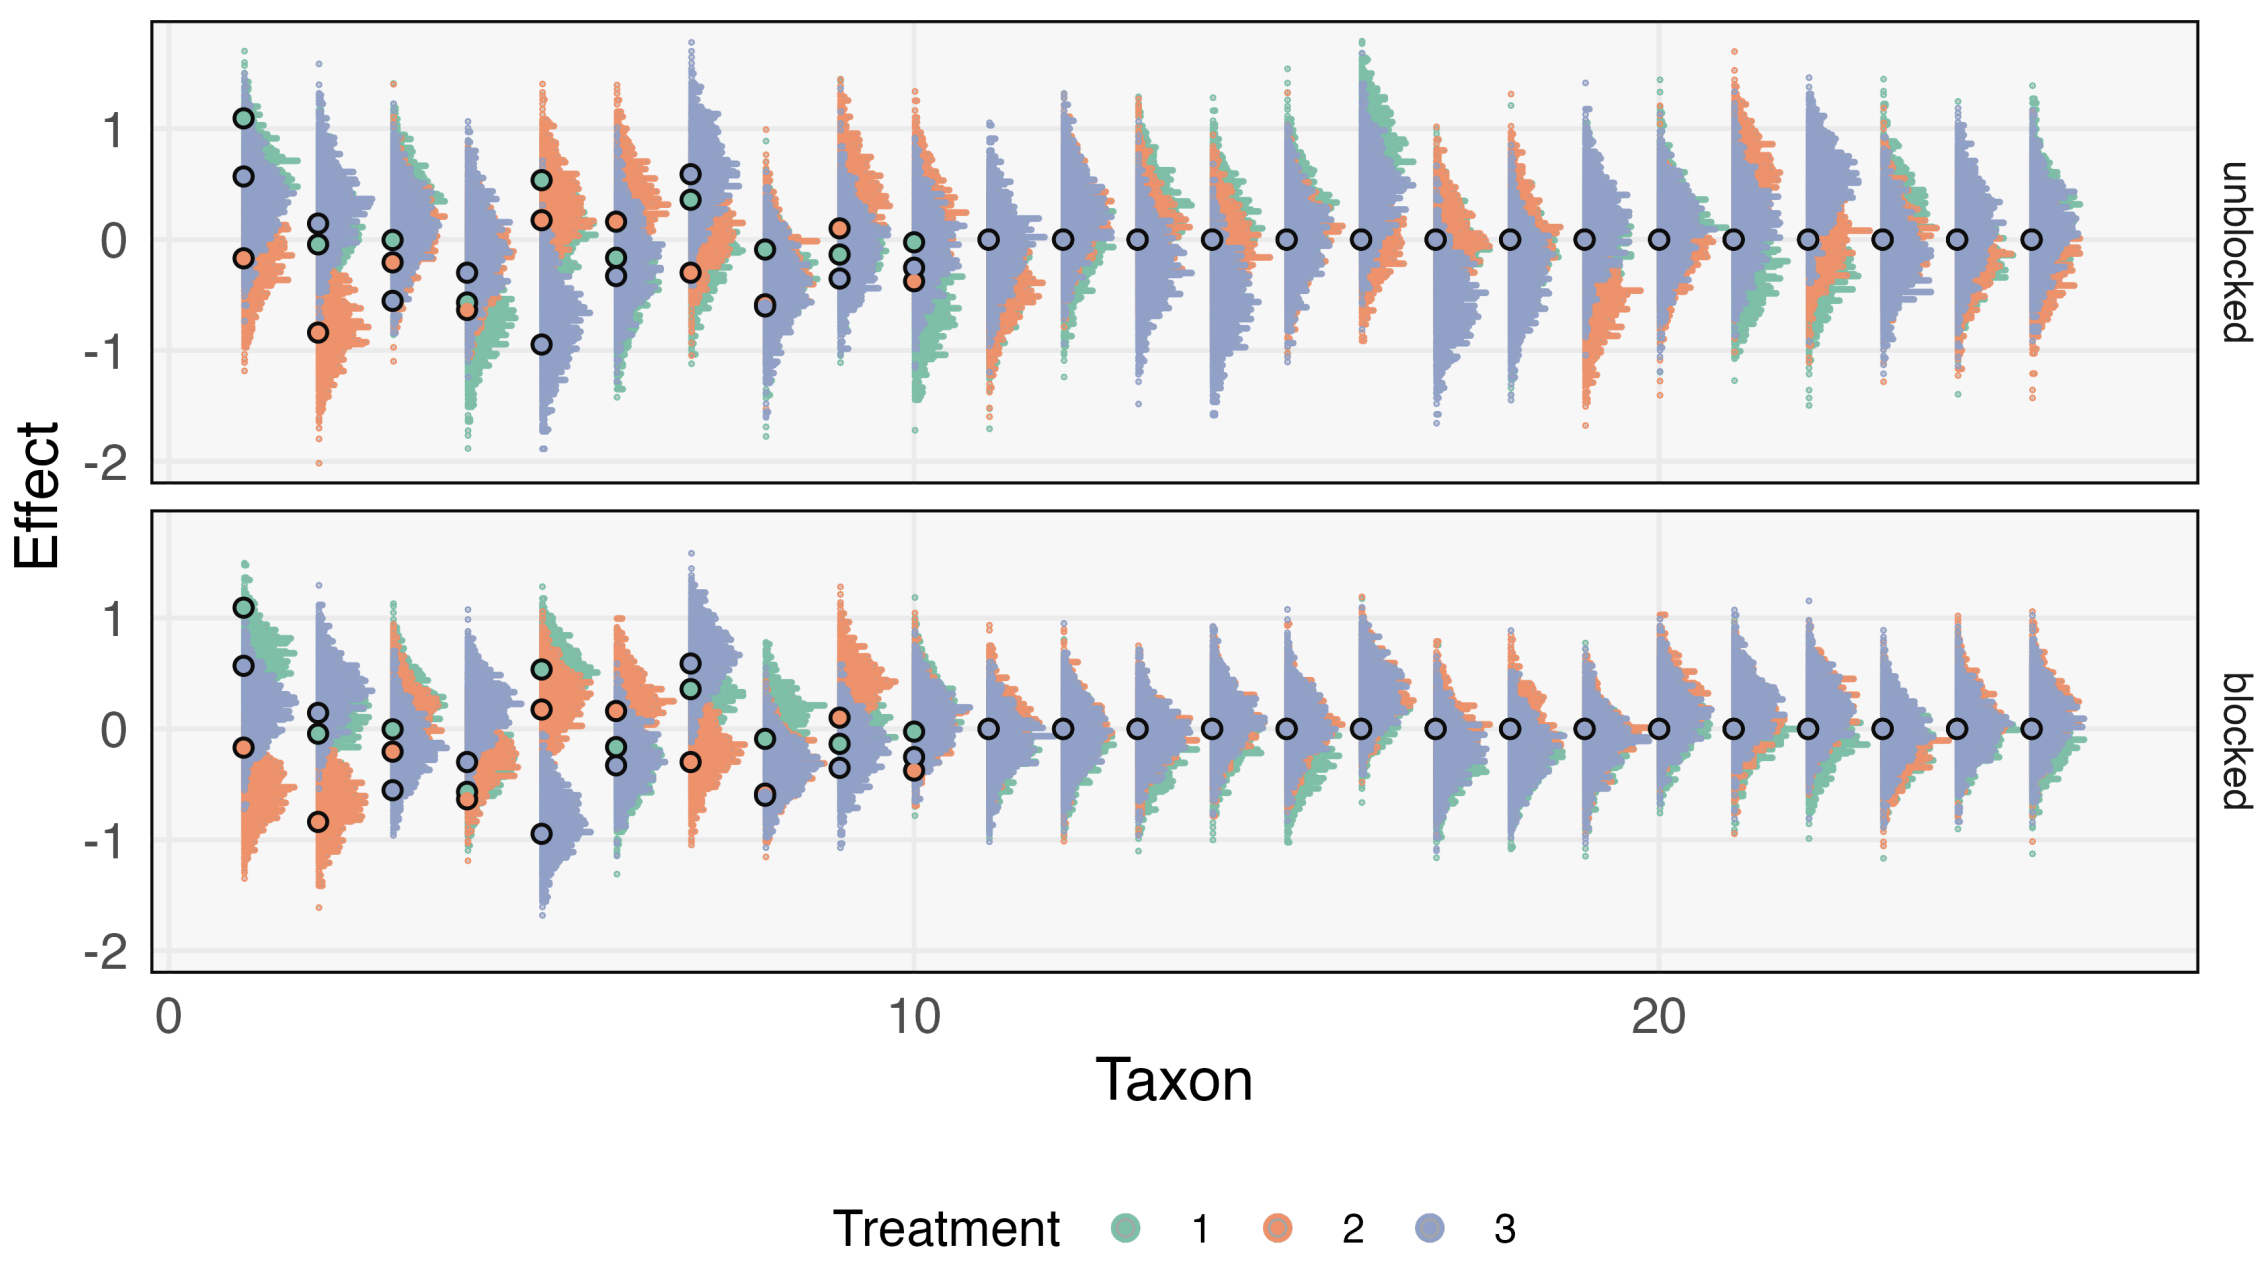
mbtransfer: Microbiome Intervention Analysis using Transfer Functions and Mirror Statistics
Kris Sankaran and Pratheepa Jeganathan
Paper: PLOS Computational Biology | PDF
Code:
Microbiome composition modulates secondary metabolism in a multispecies bacterial community
Marc G. Chevrette, Chris S. Thomas, Amanda Hurley, Natalia Rosario-Meléndez, Kris Sankaran, Yixing Tu, Austin Hall, Shruthi Magesh, and Jo Handelsman
Paper: Proceedings of the National Academy of Sciences | PDF
Code:
Generative Models: An Interdisciplinary Perspective
Kris Sankaran, Susan P. Holmes
Paper: Annual Reviews in Statistics and its Applications | PDF
Code:
Spatial Transcriptomics Dimensionality Reduction using Wavelet Bases
Zhuoyan Xu and Kris Sankaran
Paper: Under Review | PDF
Code:
Artificial Intelligence for Climate Change Adaptation
So-Min Cheong, Kris Sankaran, Hamsa Bastani
Paper: WIRES Data Mining and Knowledge Discovery. April 2022. https://doi.org/10.1002/widm.1459 | PDF
Source Data Selection for Out-of-Domain Generalization
Xinran Miao and Kris Sankaran
Paper: Under review. | PDF
Code:
Estimating Glacial Lake Trends using Historically Guided Segmentation Models
Weiyushi Tian, Anthony Ortiz, Tenzing C. Sherpa, Finu Shresta, Mir Matin, Rahul Dodhia, Juan M. Lavista Ferres, and Kris Sankaran
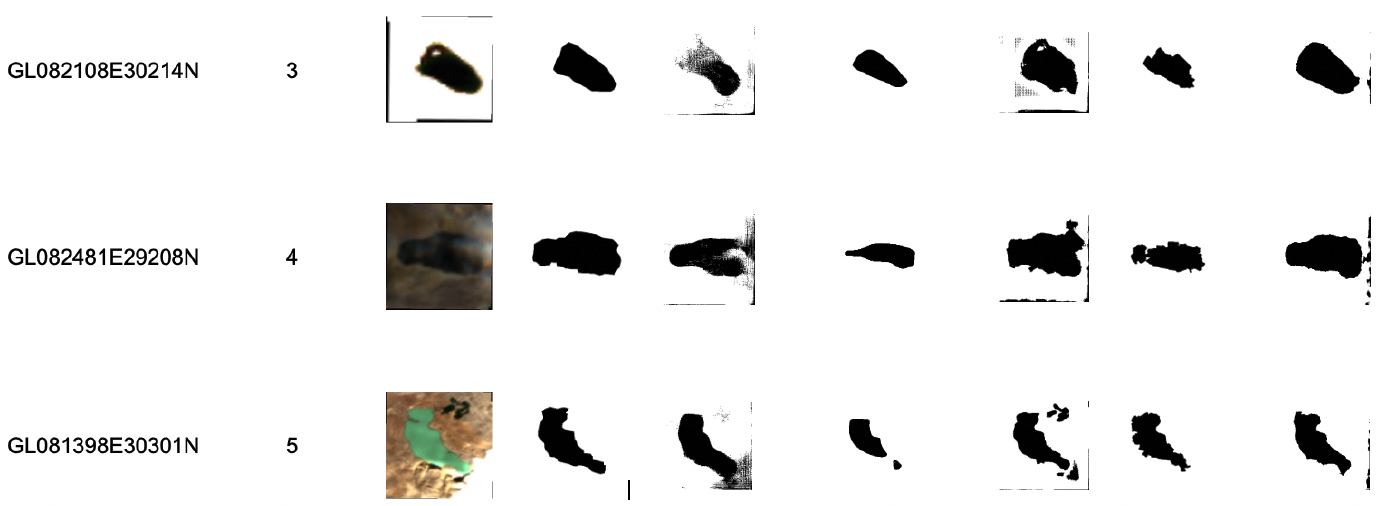
Paper: IEEE Journal of Selected Topics in Applied Earth Observations and Remote Sensing | PDF
Code:
Interactive Visualization and Representation Analysis Applied to Glacier Segmentation
Minxing Zheng, Xinran Miao, Kris Sankaran
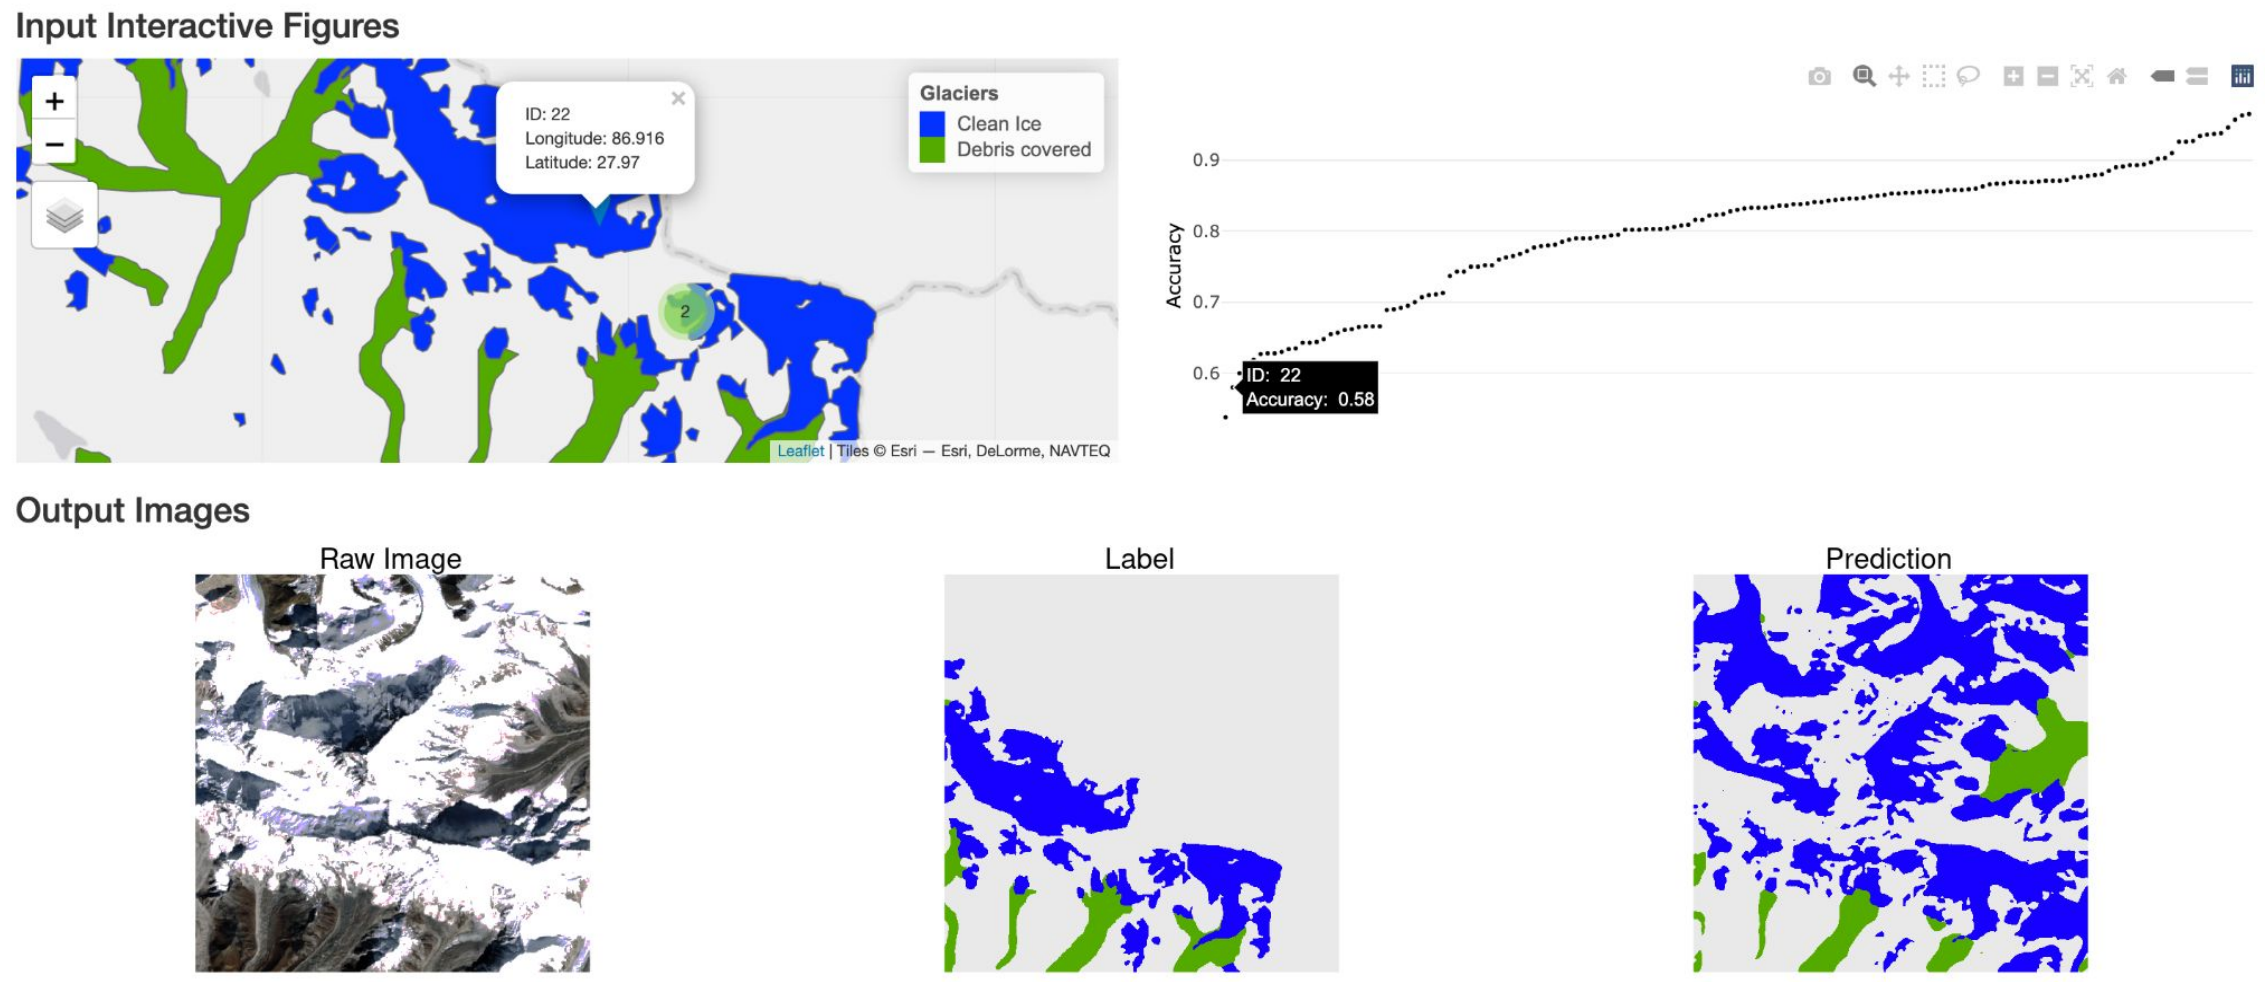
Paper: ISPRS International Journal for Geoinformation. 11(8). | PDF
Code:
Interactive Visualization of Spatial Omics Neighborhoods
Tinghui Xu, Kris Sankaran
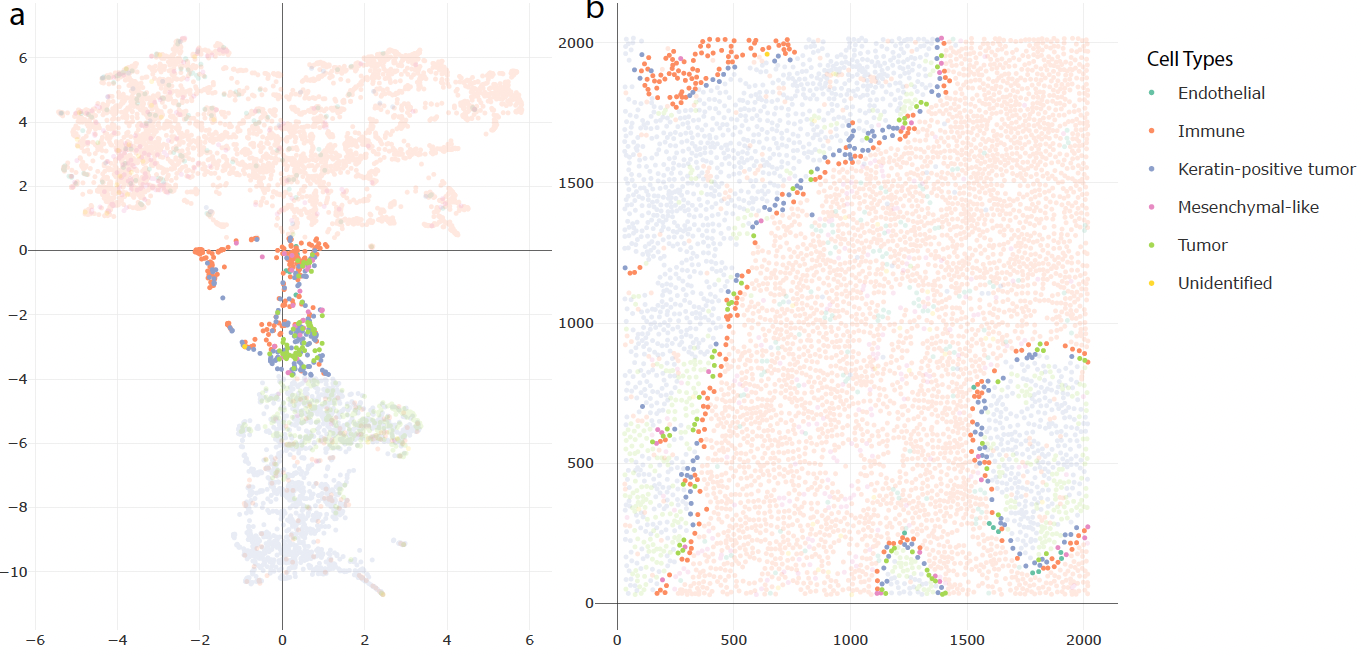
Paper: F1000 Research | PDF
Code:
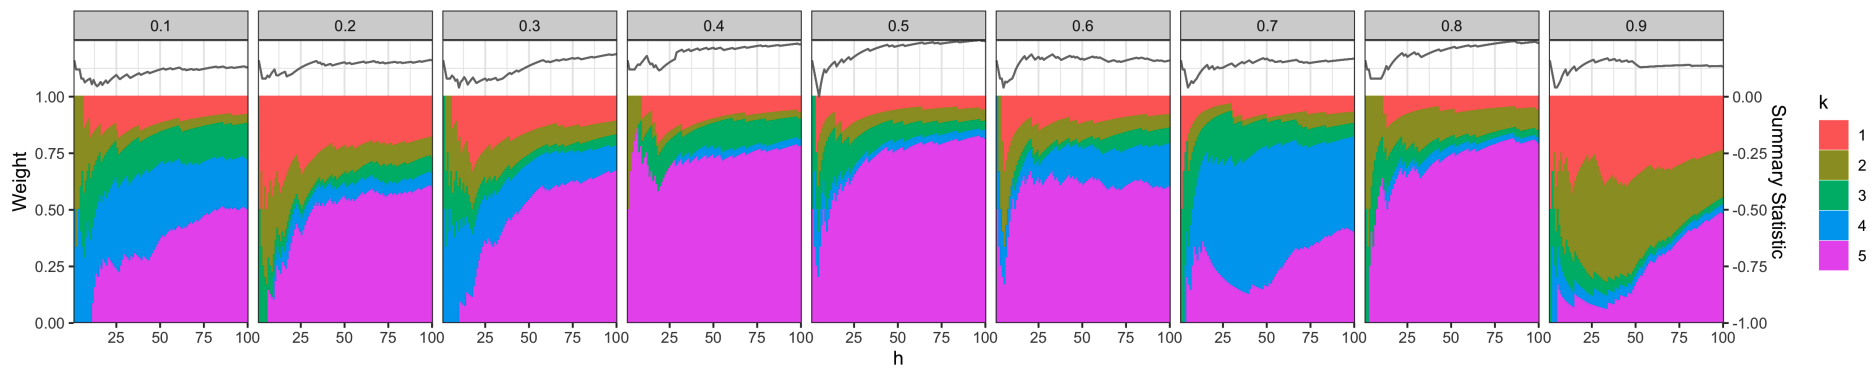
Multiscale Analysis of Count Data through Topic Alignment
Julia Fukuyama, Kris Sankaran, Laura Symul
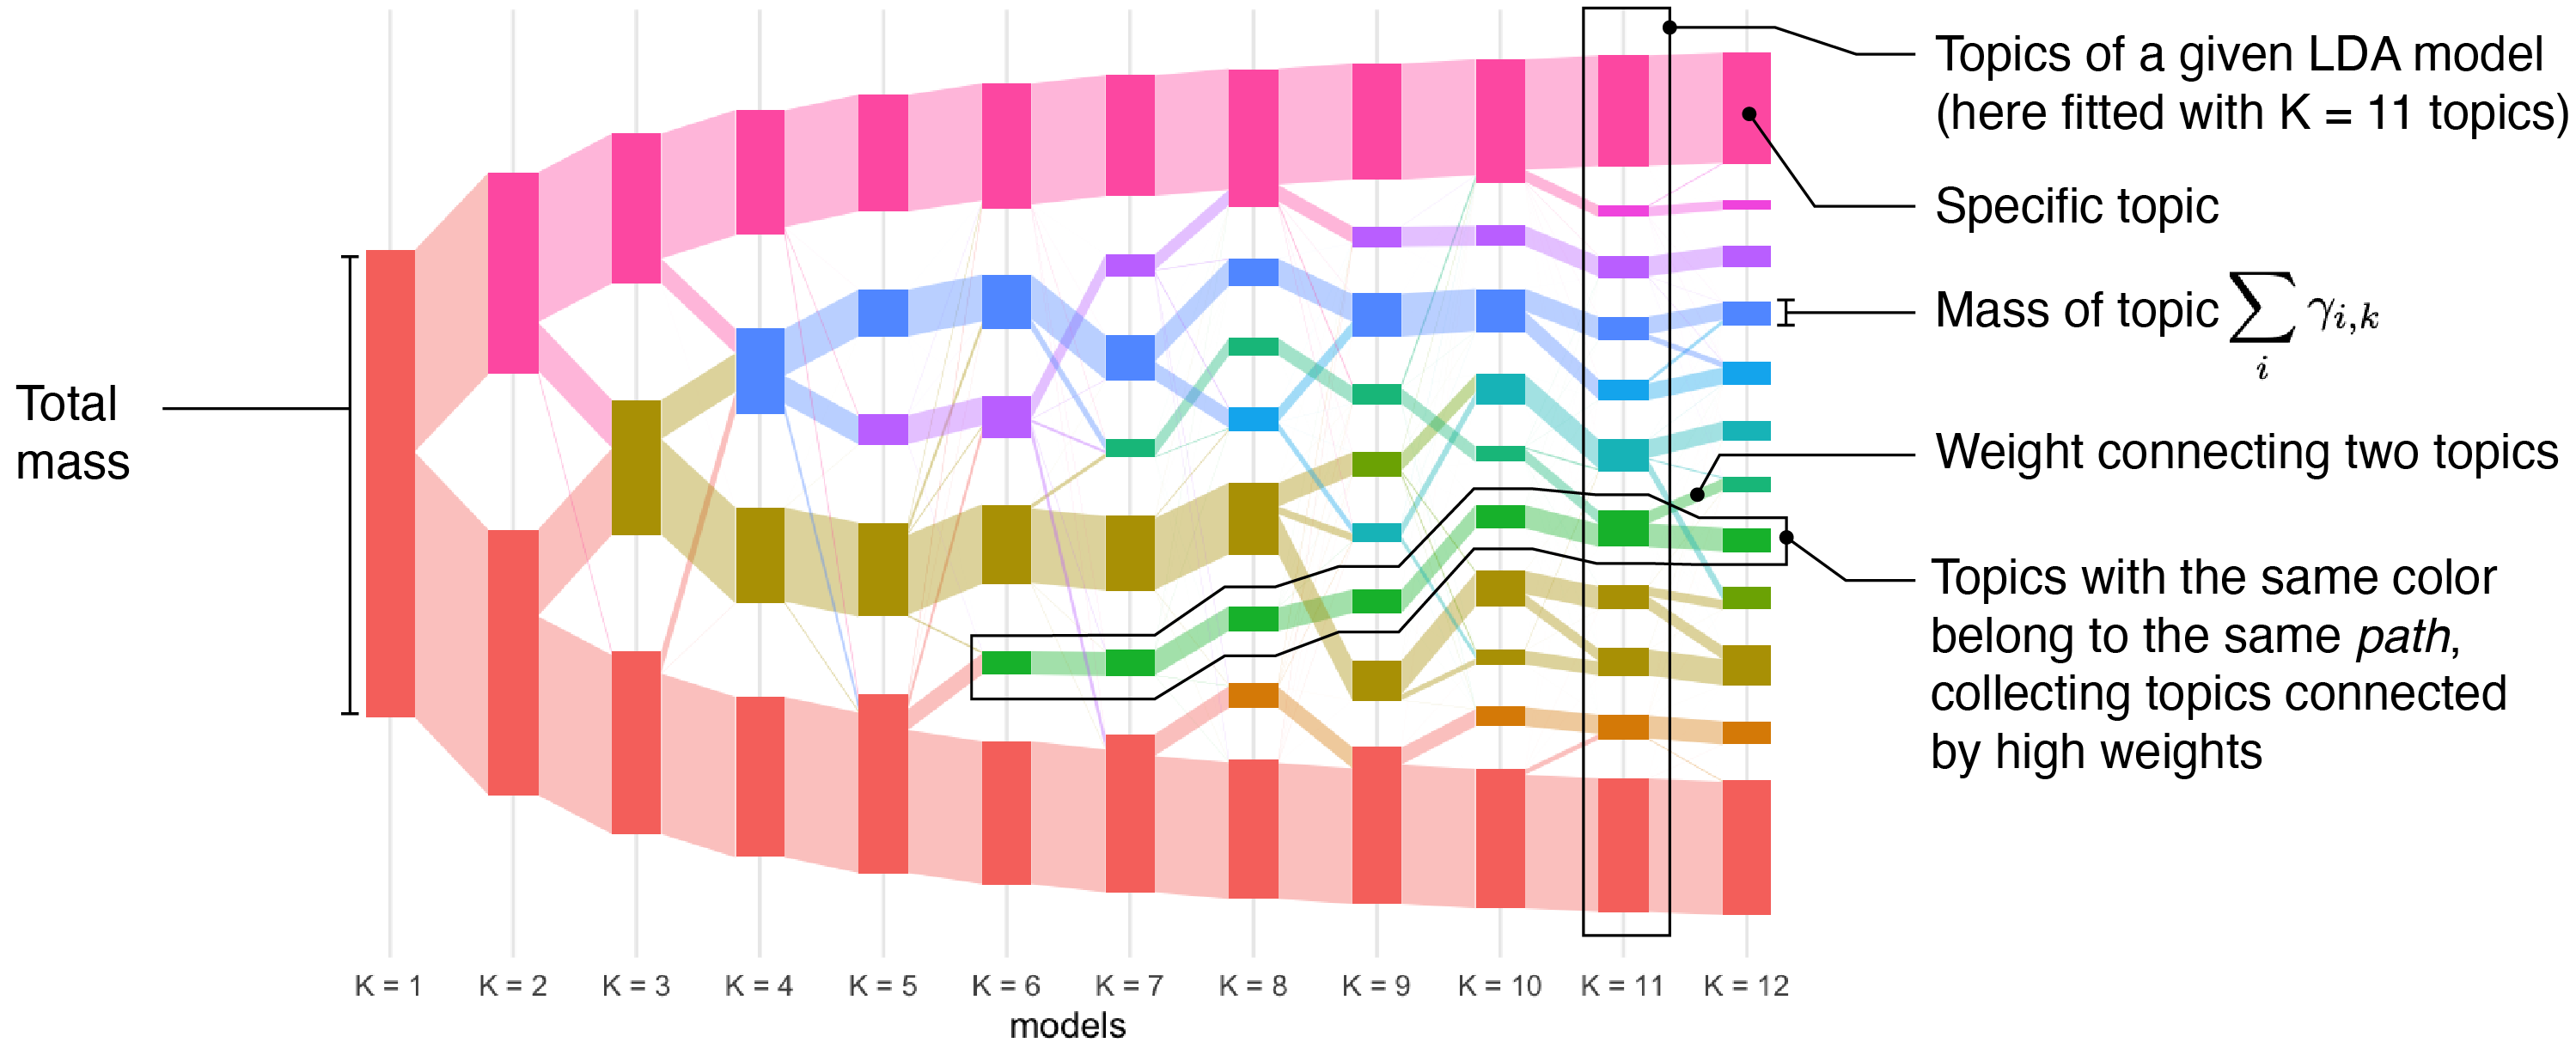
Paper: Biostatistics | PDF
Code:
Bootstrap Confidence Regions for Learned Feature Embeddings
Kris Sankaran
Paper: Journal of Computational and Graphical Statistics | PDF
Code:
Machine Learning for Glacier Monitoring in the Hindu Kush Himalaya
Shimaa Baraka, Benjamin Akera, Bibek Aryal, Tenzing Sherpa, Finu Shresta, Anthony Ortiz, Kris Sankaran, Juan Lavista Ferres, Mir Matin, Yoshua Bengio
Paper: Climate Change AI Workshop (Spotlight). December 9, 2020. | PDF
Code:
Tackling Climate Change with Machine Learning
David Rolnick, Priya L Donti, Lynn H Kaack, Kelly Kochanski, Alexandre Lacoste, Kris Sankaran, Andrew Slavin Ross, Nikola Milojevic-Dupont, Natasha Jaques, Anna Waldman-Brown, Alexandra Luccioni, Tegan Maharaj, Evan D Sherwin, S Karthik Mukkavilli, Konrad P Kording, Carla Gomes, Andrew Y Ng, Demis Hassabis, John C Platt, Felix Creutzig, Jennifer Chayes, Yoshua Bengio
Paper: ACM Computing Surveys | PDF
Latent Variable Modeling for the Microbiome
Kris Sankaran, Susan P Holmes
Paper: Biostatistics. October 2019. https://doi.org/10.1093/biostatistics/kxy018 | PDF
Code:
Multitable Methods for Microbiome Data Integration
Kris Sankaran, Susan P Holmes
Paper: Frontiers in Genetics. August 28, 2019. https://doi.org/10.3389/fgene.2019.00627 | PDF
Code:
Sex-specific Association between Gut Microbiome and Fat Distribution
Yan Min, Xiaoguang Ma, Kris Sankaran, Yuan Ru, Lijin Chen, Mike Baiocchi, Shankuan Zhu
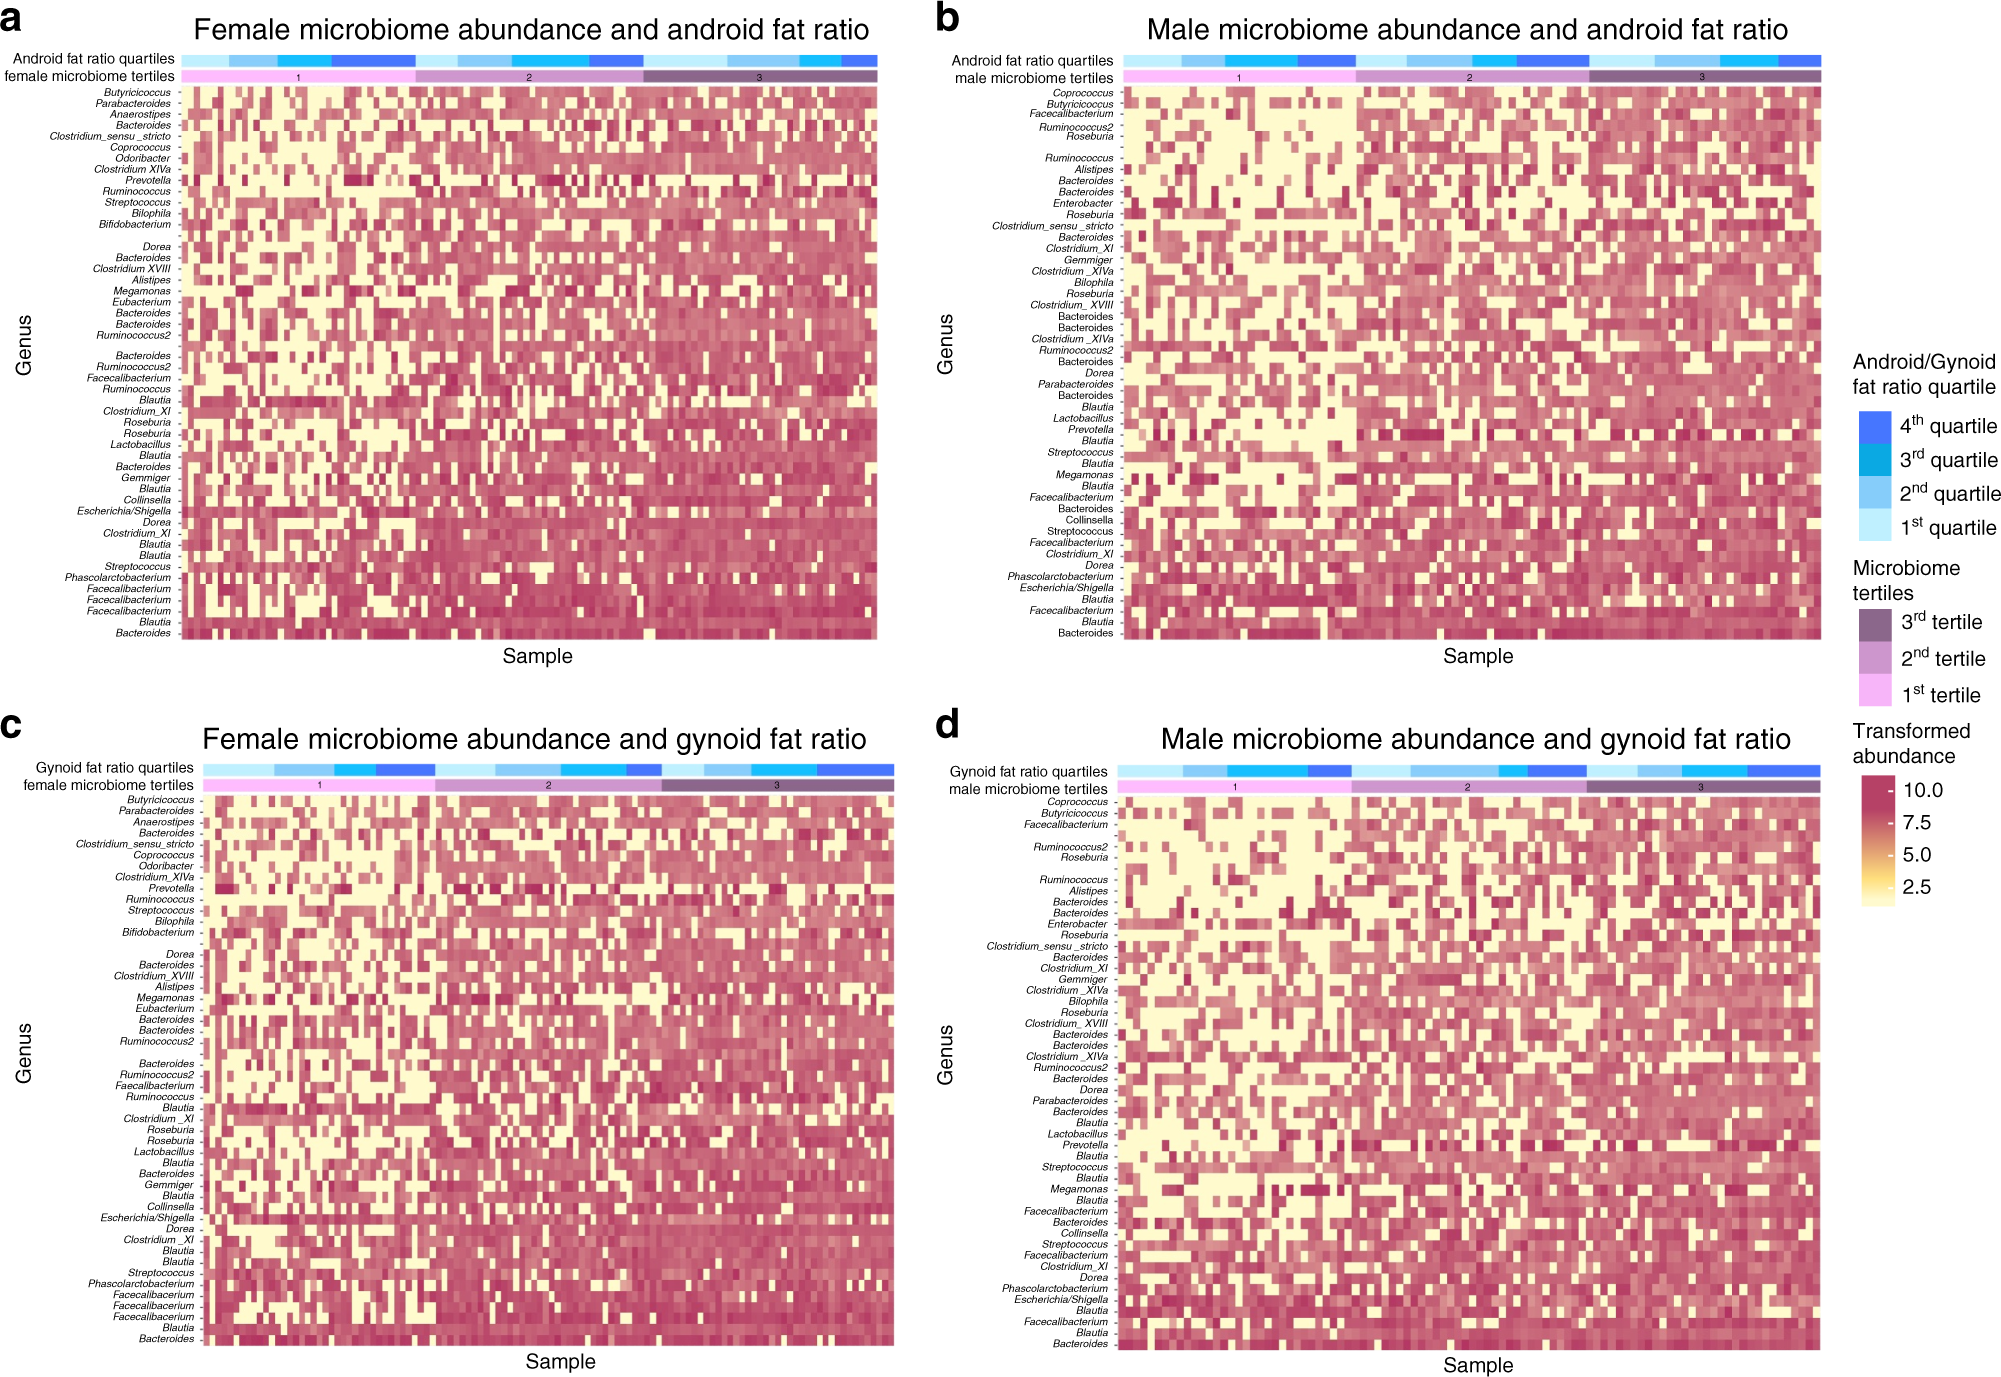
Paper: Nature Communications volume. June 3, 2019. https://doi.org/10.1038/s41467-019-10440-5 | PDF
Code:
Interactive Visualization of Hierarchically Structured Data
Kris Sankaran, Susan P Holmes
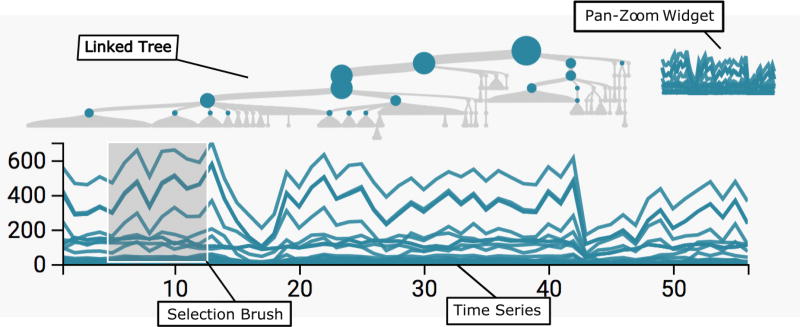
Paper: Journal of Computational and Graphical Statistics. | PDF
Code:
Bioconductor Workflow for Microbiome Data Analysis - from raw reads to community analyses
Ben Callahan, Kris Sankaran, Julia Fukuyama, Paul Joey McMurdie, Susan P Holmes
Paper: F1000 Research. | PDF
Code: