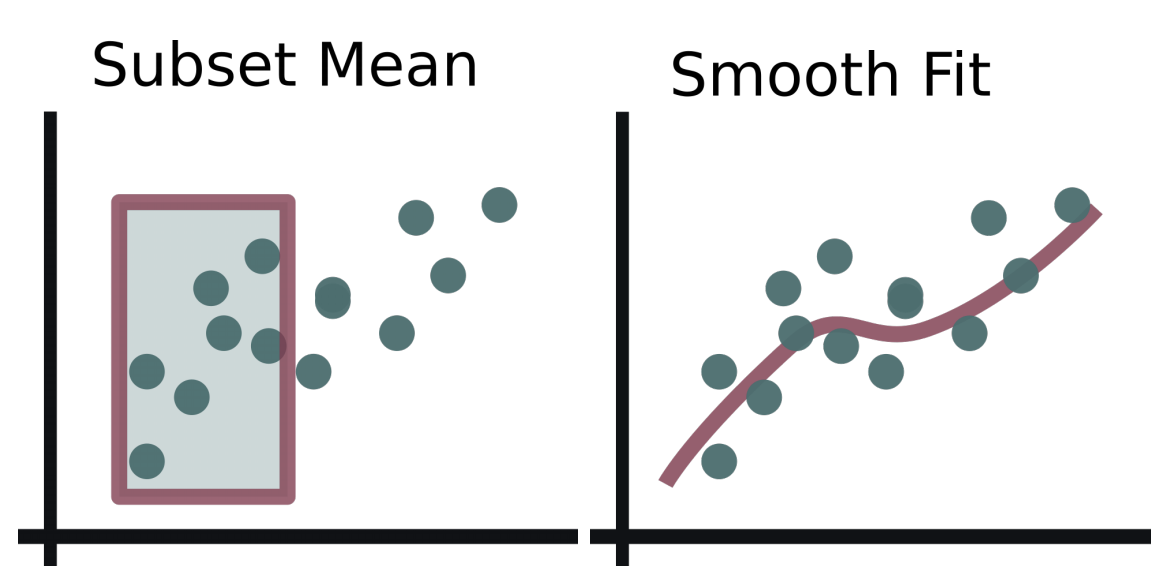
We made an effort to strengthen links between visualization and statistical modeling, with the high-level view that both fields offer approaches to data compression for human consumption. It was awarded the Jerome H. Friedman Applied Statistics Dissertation Award and was chosen as Stanford's nomination to the Council for Graduate Studies Dissertation Award (Math, Physical Sciences, and Engineering). |
We survey a variety of algorithmic and probabilistic approaches
to the problem of applying dynamic regimes in the microbiome,
along with illustrative examples and code.
|
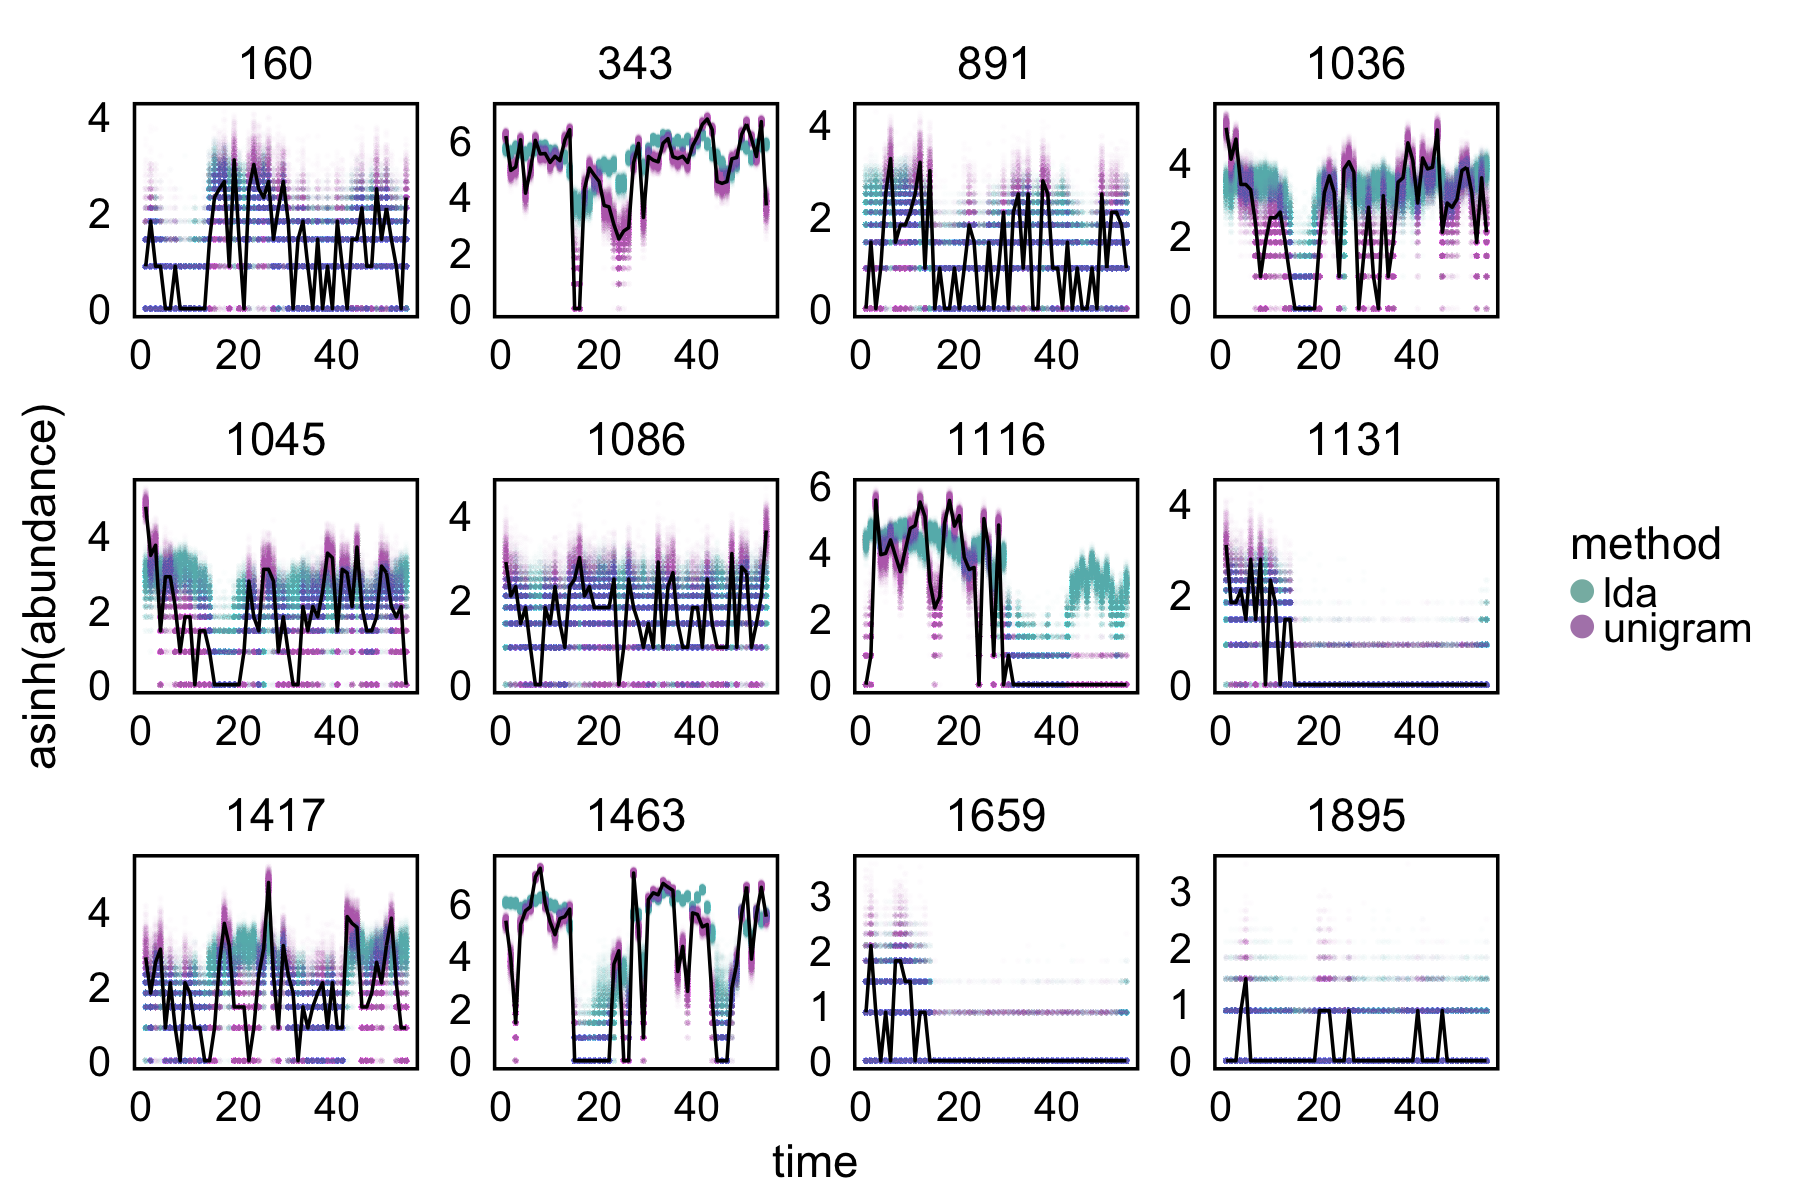
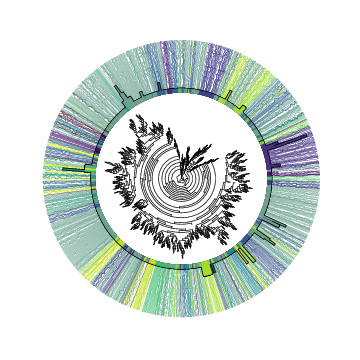
We applied probabilistic text modeling ideas to the microbiome, comparing methods and providing example workflows.
|
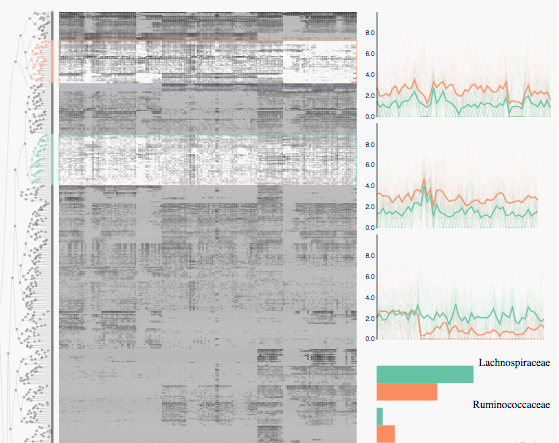
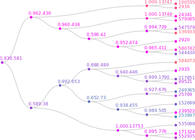
We developed an R package for simultaneous visualization of trees and heatmaps, based on linked brushing. |
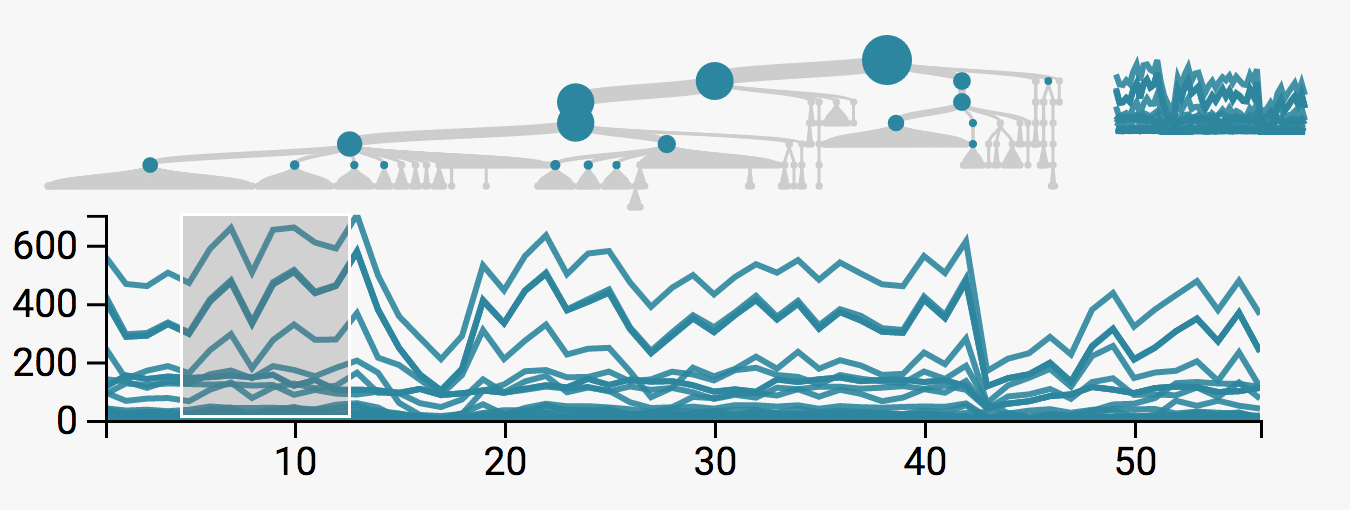
An R package for interactive visualization of tree-structured time series, based on focus / context and linked brushing ideas. |
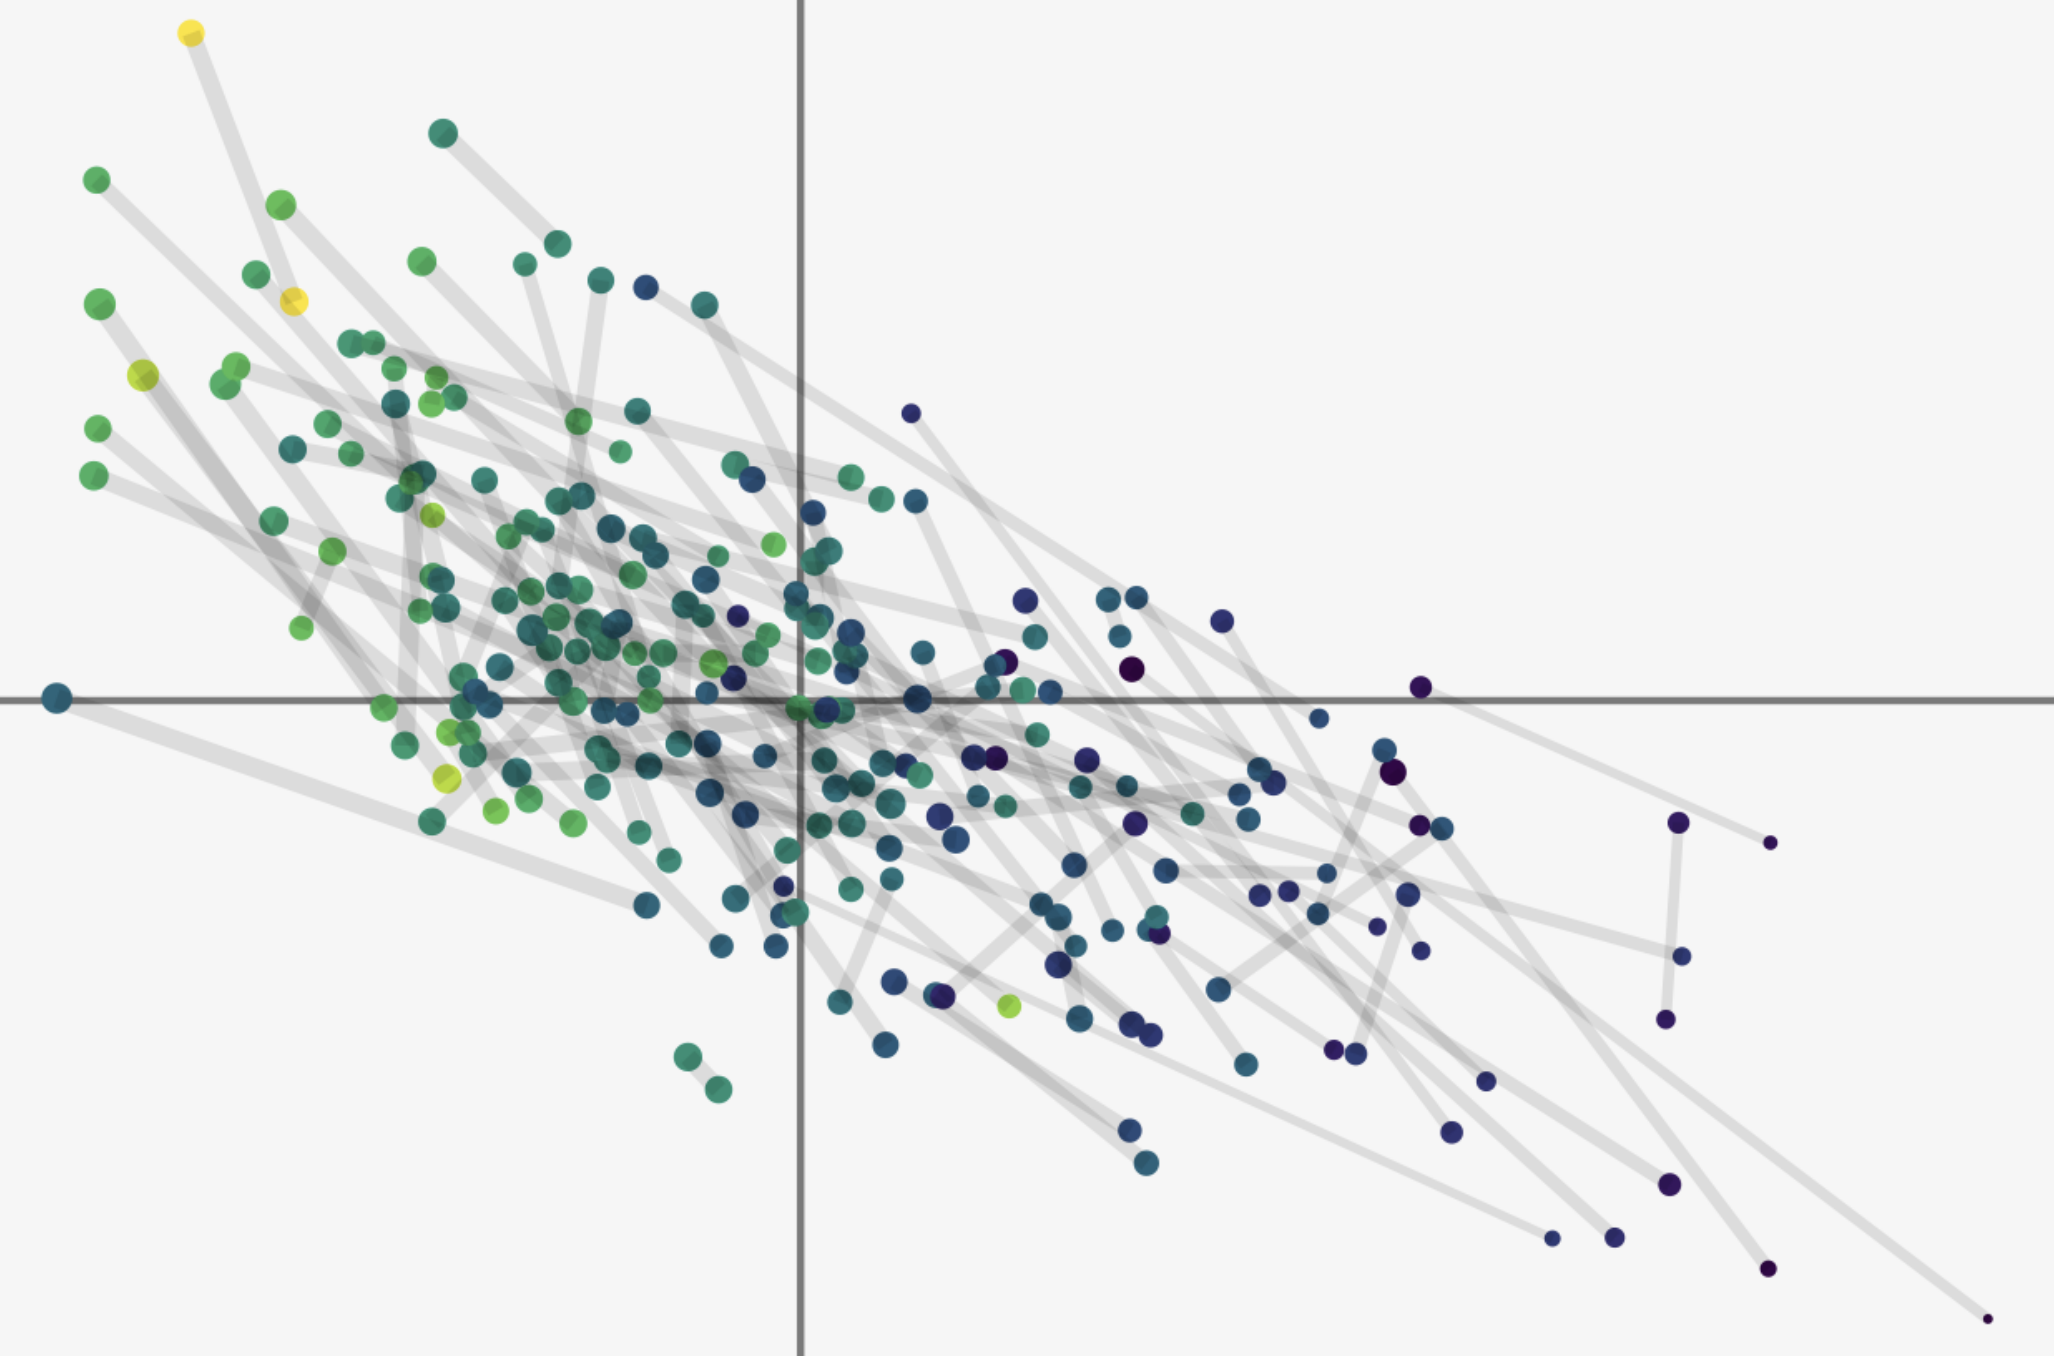
We experimented with several perspectives for learning from multitable datasets, and offer some guidelines for their application to the microbiome context. |
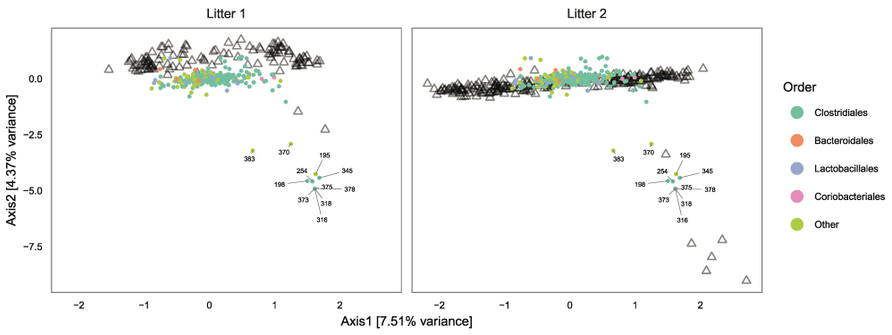
We studied the effects of colon cleanouts on the microbiome, applying novel methods to incorporate phylogenetic tree structure. |
We described and provided code for a full workflow for microbiome data processing and analysis. |
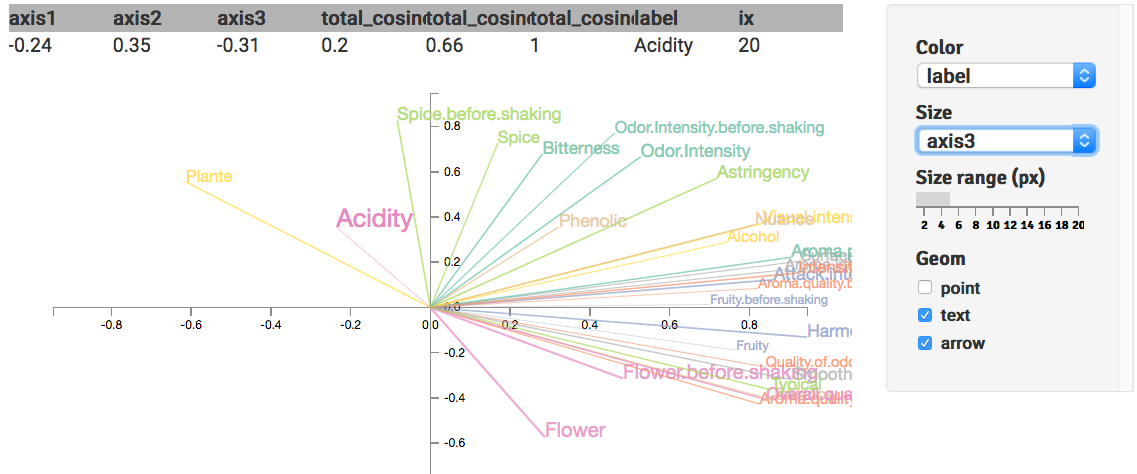
Using htmlwidgets, we developed an R package that generates interactive plots of standard multivariate analysis methods, via the FactoMineR, ade4, and vegan packages. |
We created an R package implementing multiple testing procedures applicable to group and hierarchically structured data, and demonstrated their relevance in the microbiome setting. |
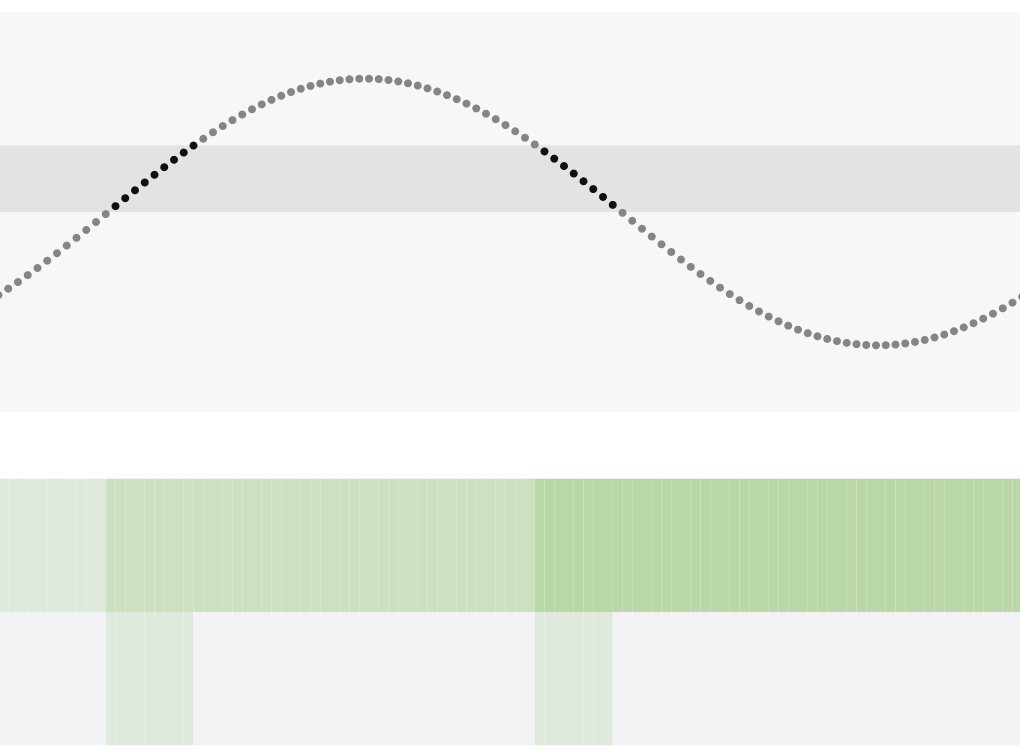
This piece explains recurrent neural networks using interactive views of a one-dimensional example. It also highlights connections between sequential processing and statistical sufficiency, and probably has the silliest title of anything I've written (yet!). |
We've been trying to create more opportunities for people to contribute
to humanitarian AI projects. The term can be quite broad, which makes
it important that work is coordinated across teams, to maintain
coherence.
|
From detecting leaks in methane pipes to accounting for uncertainty in
future reservoir loads, machine learning has the potential to amplify
a wide variety of (big and small) climate change mitigation and
adaptation efforts.
|
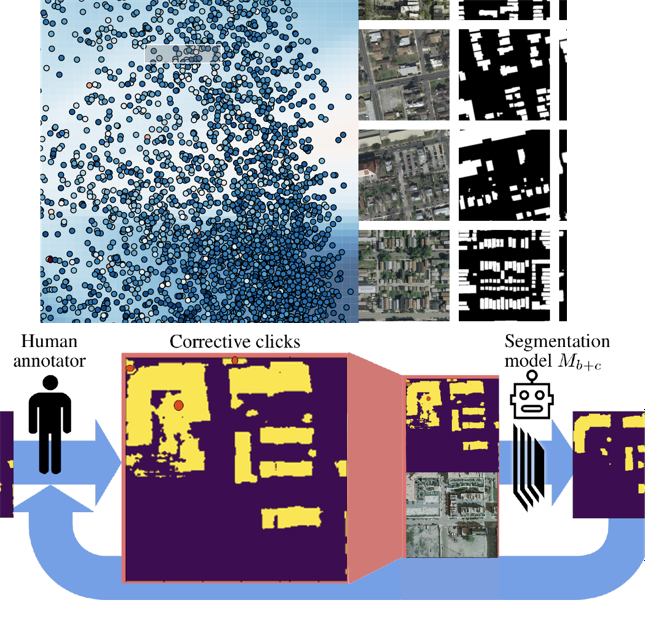
Effective processing of aerial imagery is important for a variety of
socially relevant applications, from conversation monitoring to crisis
preparedness. We've worked directly on applications as well as pursued
improved methodology.
|
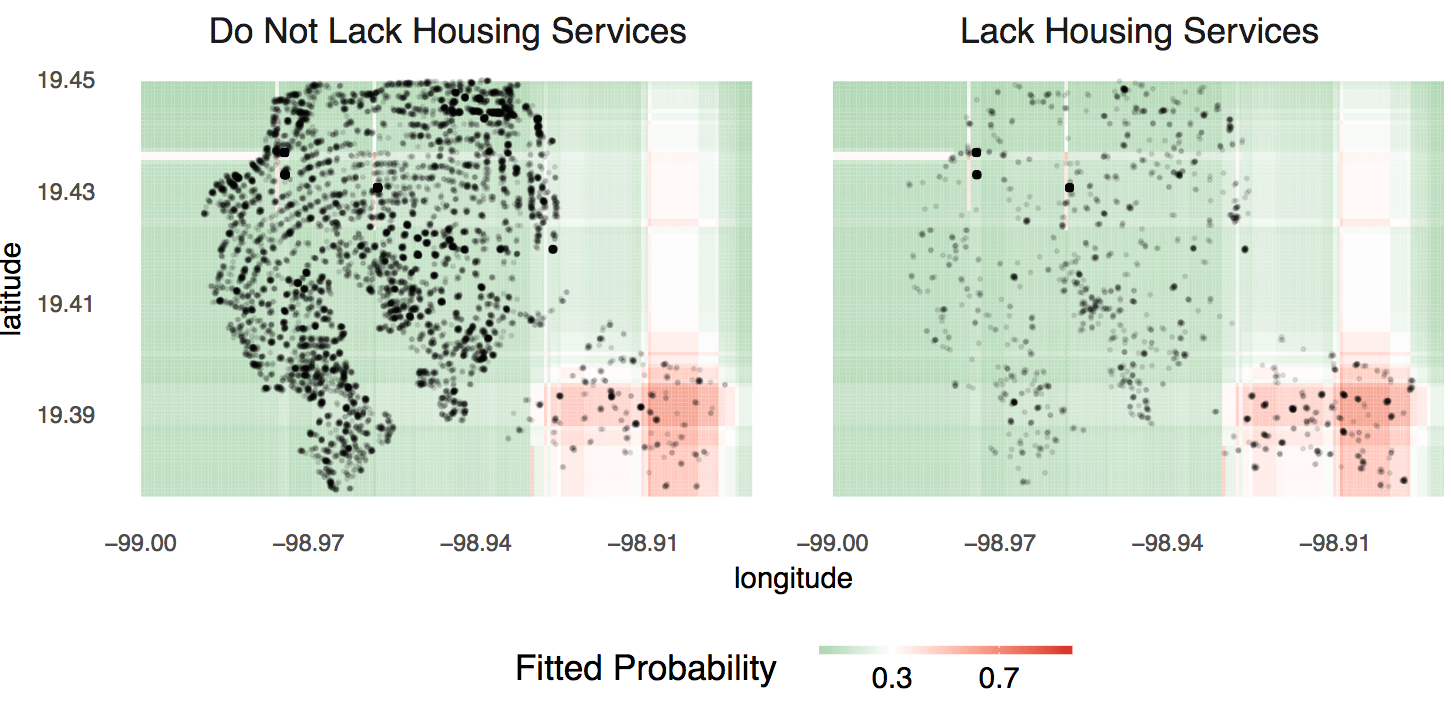
Data Science for Social Good and SEDESOL worked together to design and implement a pilot machine learning system for enhancing the distribution of social services in Mexico. |
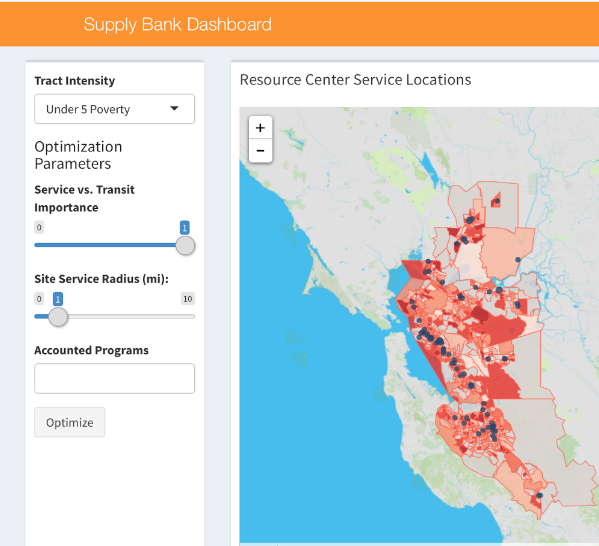
As a Data Ambassador for DataKind San Francisco I helped a volunteer team scope and develop a data exploration tool for SupplyBank.Org to select partner sites to distribute baby hygiene kits effectively and equitably. |
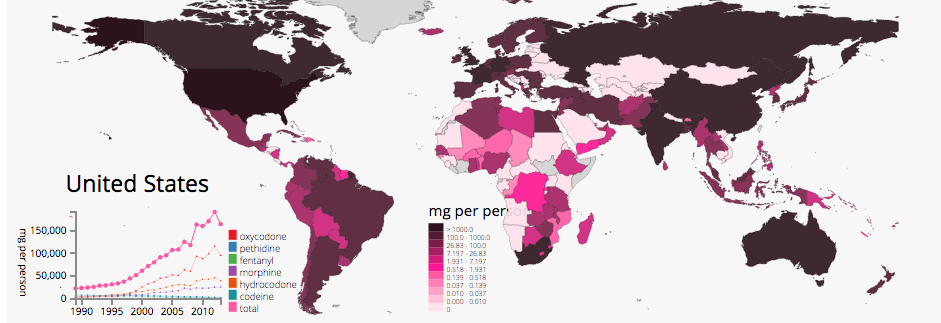
Stanford Statistics for Social Good and the Global Oncology Initiative worked together to develop interactive visualizations to educate the public about inequities in access to palliative care. |
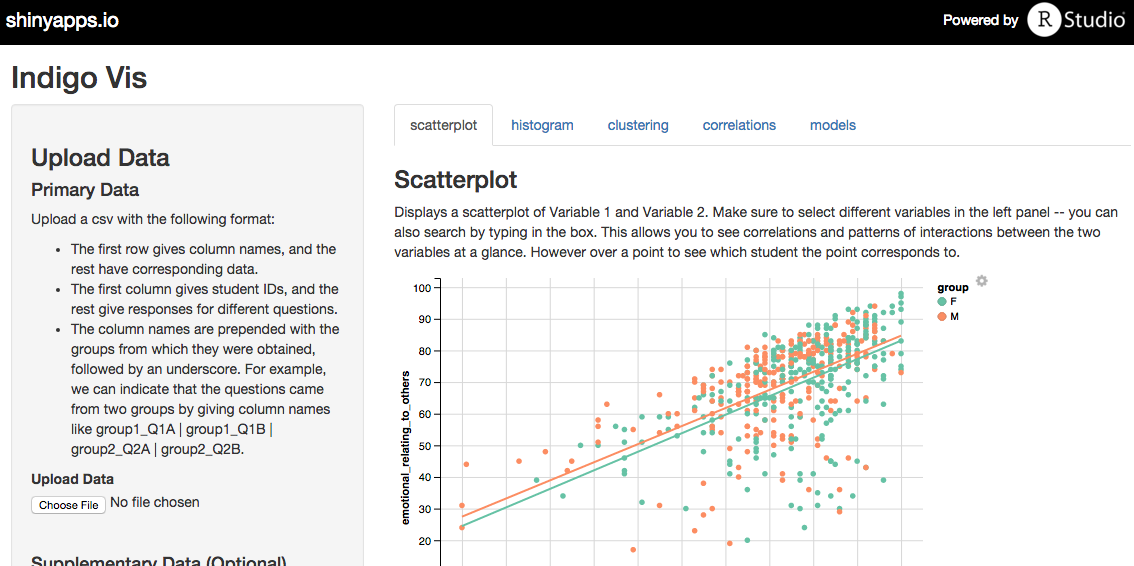
Through Statistics for Social Good we implemented a Shiny app to facilitate exploratory views of student survey data, all code is on github. |
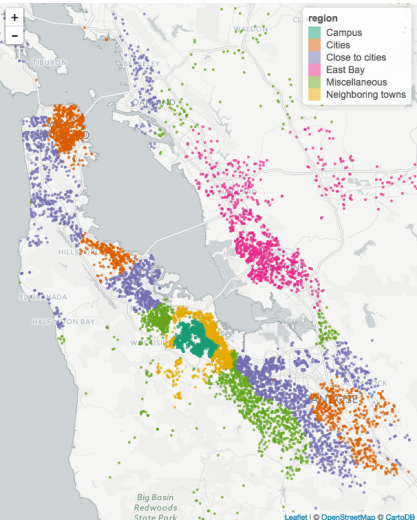
Using results from the Stanford Commute Survey, we segmented commuters who drive to work, in order to target incentives for more environmentally friendly commutes. |
We evaluated the effectiveness of financial stability and job search programs at SparkPoint drop-in centers located throughout the SF Bay Area. |
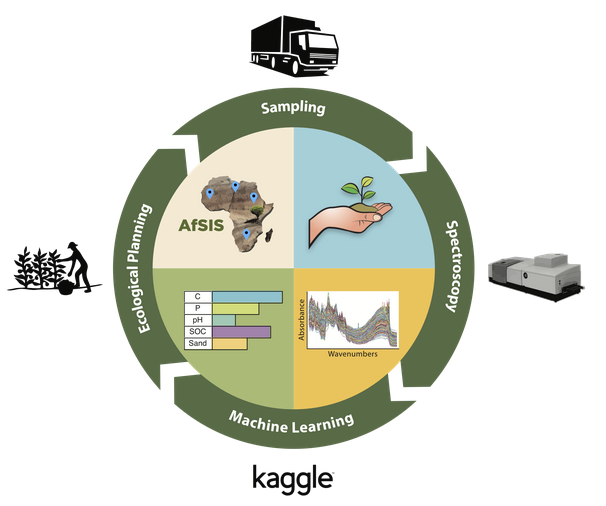
Our team from Statistics for Social Good placed in the top 11% in this kaggle competition. |
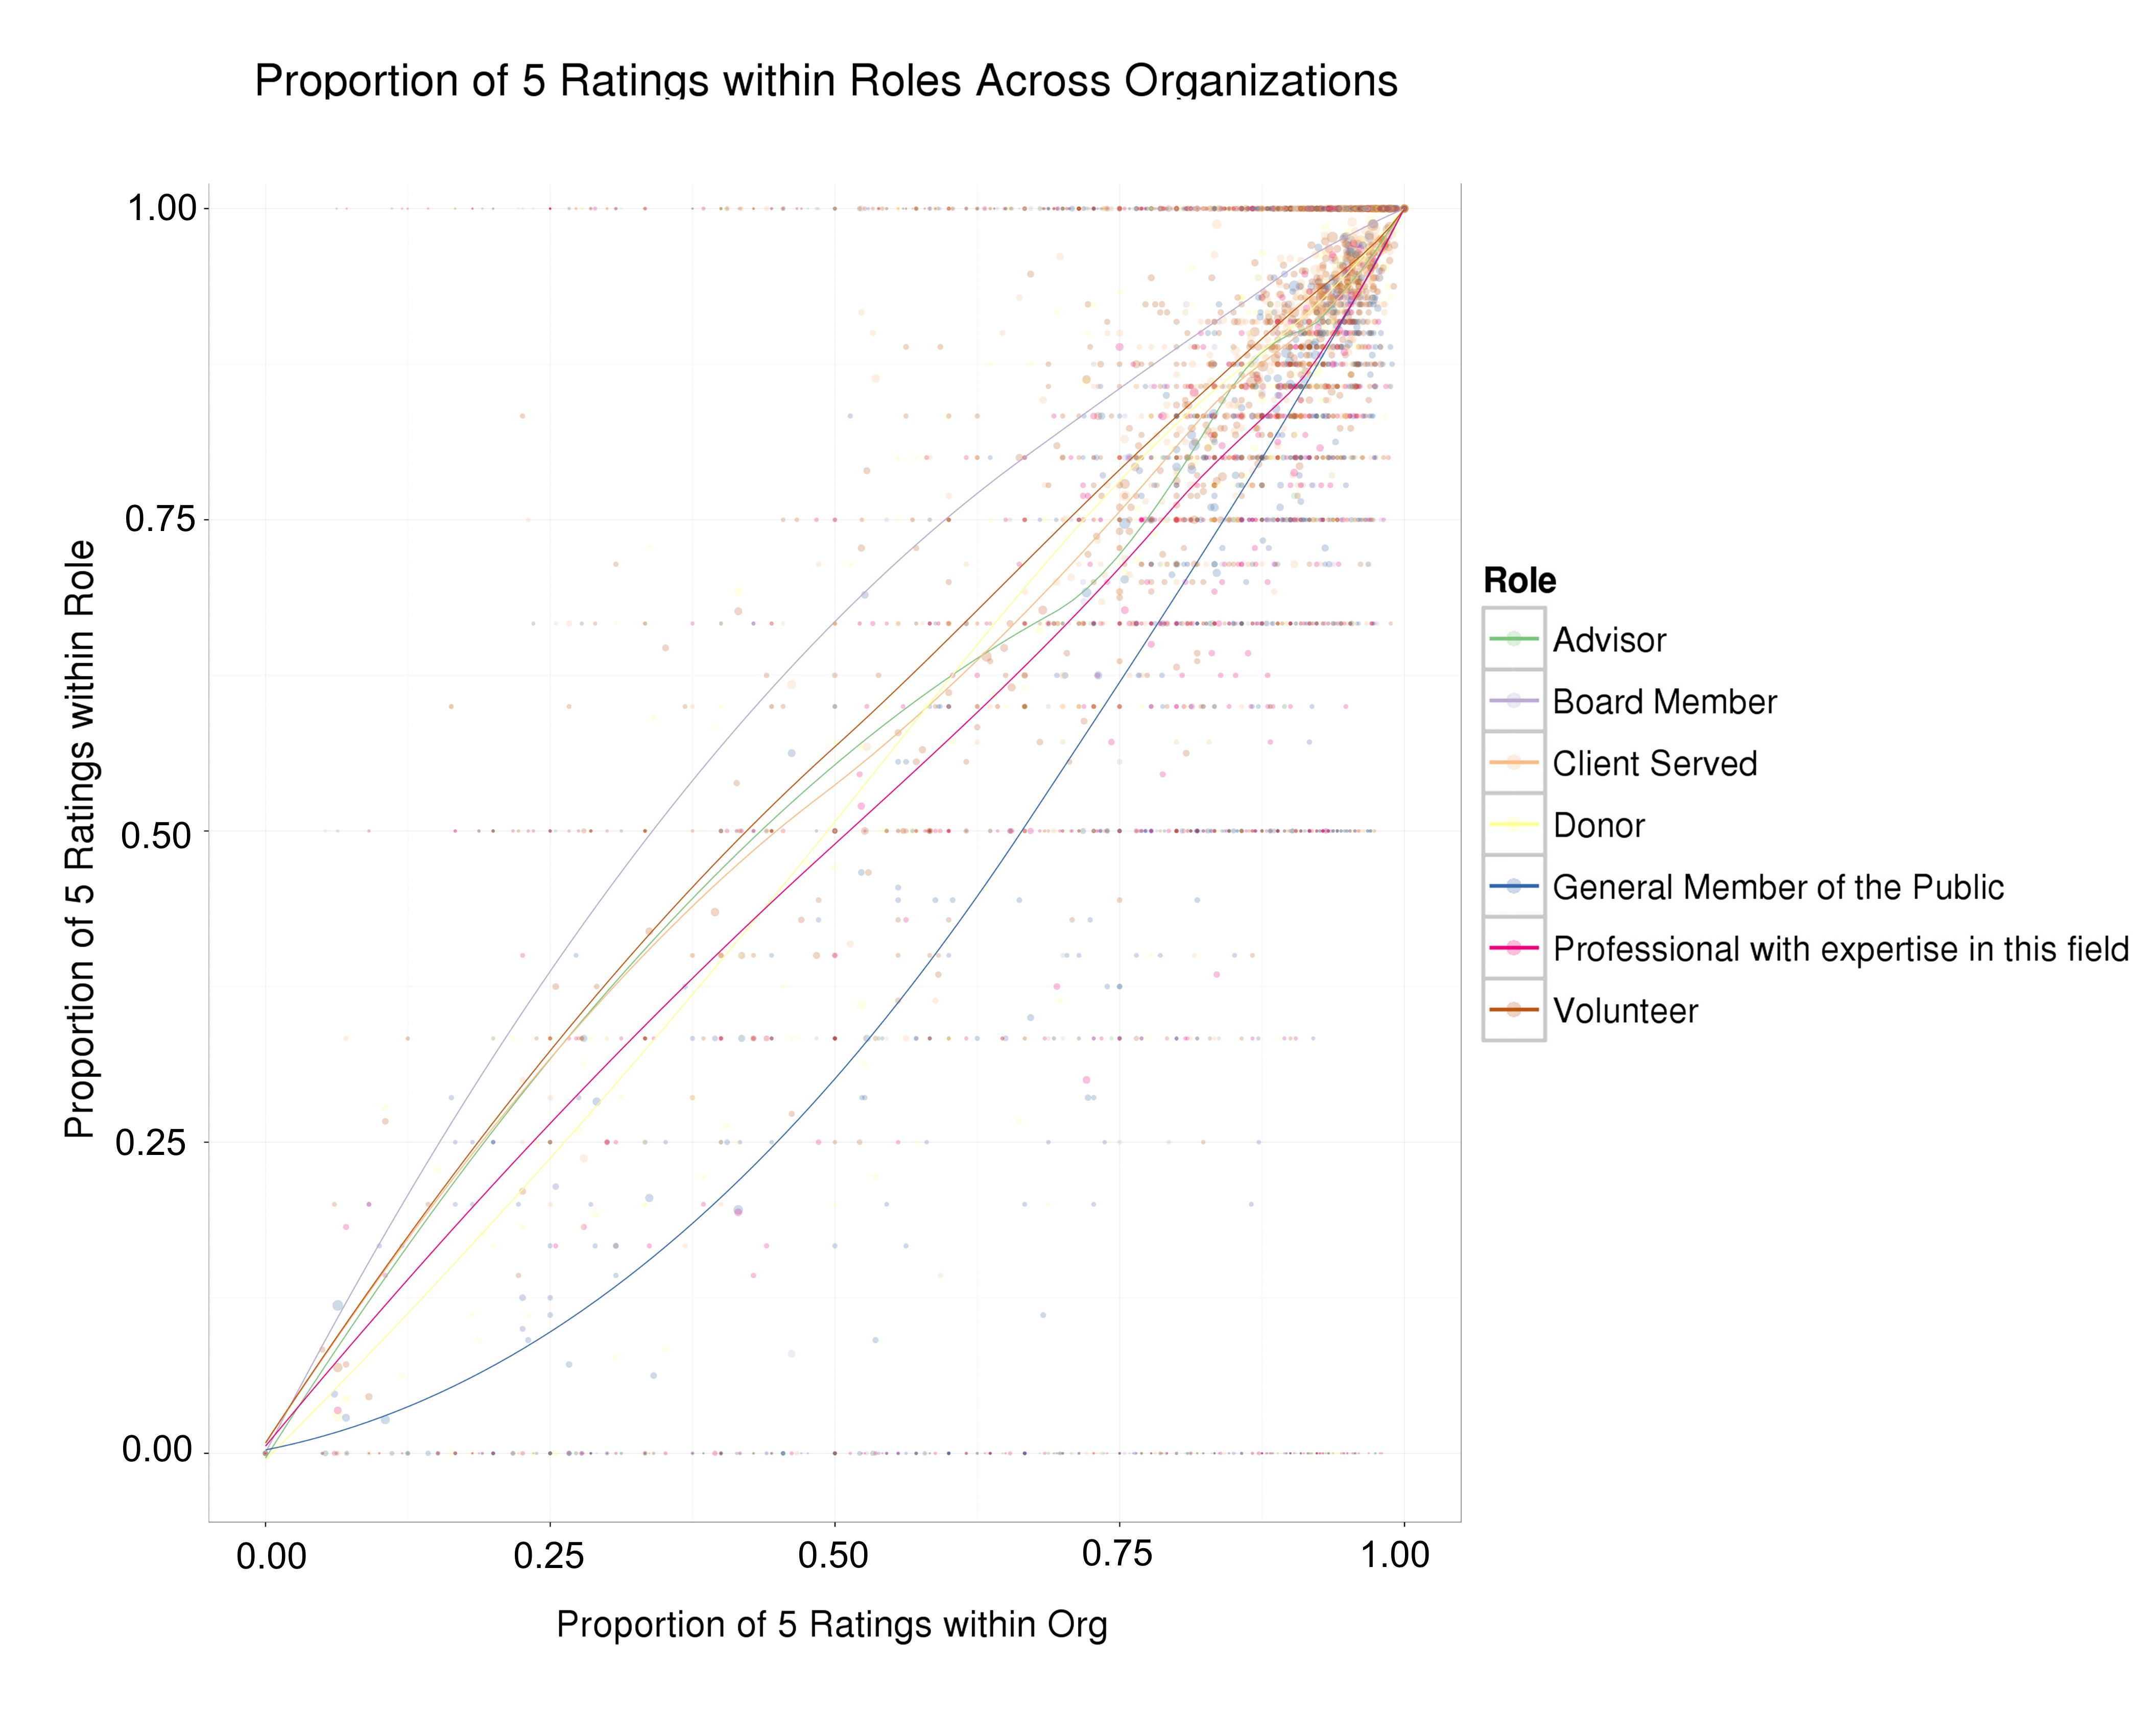
We investigated the extent of "courtesy bias" in online nonprofit reviews, and shared our results with the Stanford Social Innovation Review. |
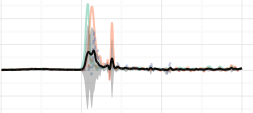
We designed algorithms to detect cytokine mixtures using data from novel nanoscale sensors. |
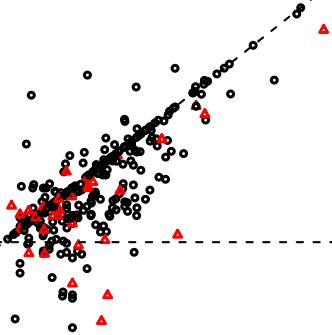
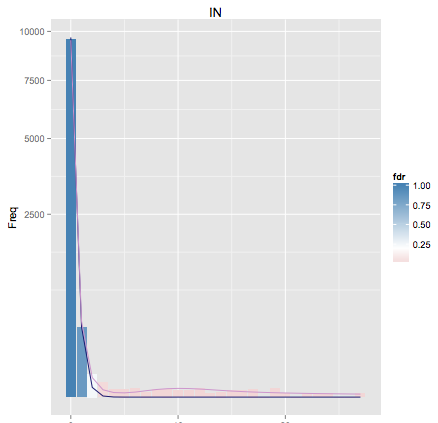
We adapted local FDR methods to perform inference of APOBEC mutations. |
As an intern, I implemented a bayesian approach rainfall disaggregation, in order to incorporate a large amount of lower-resolution data into the company's forecasting pipeline. |