treelapse
timelapse + trees = treelapse
This is an R package for interactive visualization of counts and time series arranged along trees. Motivated by the problem of describing abundances of evolutionarily related microbes, we designed representations inspired by literature in the Data Visualization community.
Installation
First, install the devtools package. Then you can get treelapse using
devtools::install_github(
  "krisrs1128/treelapse",
  dependencies = TRUE
)
The dependencies argument installs the packages that treelapse depends on
(see the DESCRIPTION file for the list) if these aren’t already available.
Examples
To view vignettes, add the argument build_vignettes = TRUE to the
installation command above and then run browseVignettes("treelapse").
It might take some time to build each of the vignettes.
Examples of the compiled vignettes are available at,
- Package introduction
- Microbial Dynamics of Antibiotics Time Courses
- Differential Microbial Abundance and Preterm Births
- Sources of Variation in Bikesharing Demand
- Dynamics in Housing Prices
- Hierarchical Clustering and the Iris Data
- Hierarchical Clustering on Global Patterns
treelapse currently supports four kinds displays
- DOI Trees: Navigate large trees according to the Degree-of-Interest (DOI) defined by clicking on different nodes.
- DOI Sankeys: Create a DOI Tree where abundances are split across several groups.
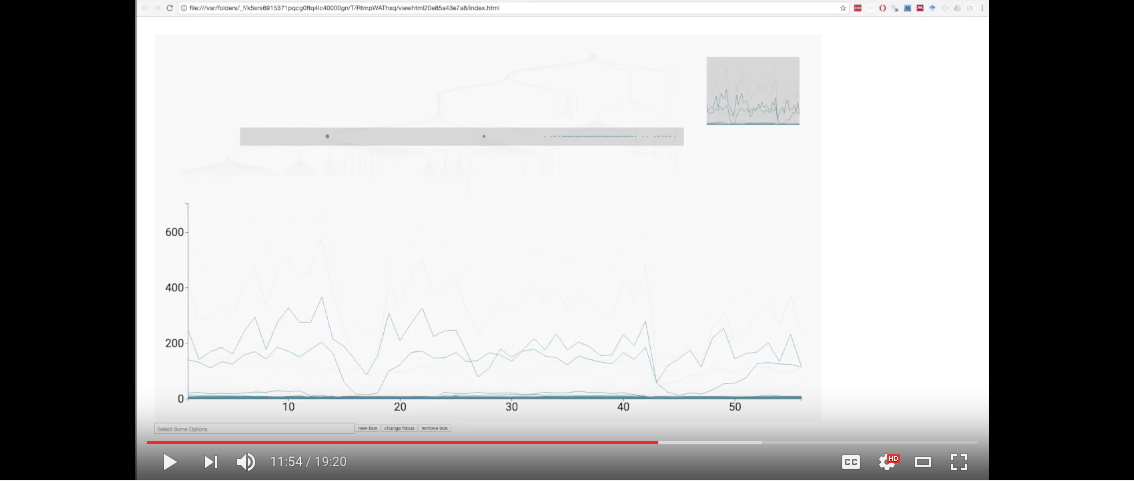
- Timeboxes: Visually query a (tree-structured) collection of time series, and see which nodes are associated with selected series.
- Treeboxes: The converse of timeboxes – select nodes and see which series are associated.
It also includes a few utilities for structuring data into the required form.
tree_sum(): Aggregate counts from leaves to internal nodes, given a tree structure.tree_mean(): Average counts from leaves to internal nodes, given a tree structure.taxa_edgelist(): Create an edgelist from a taxonomic tables whose columns are different levels in the hierarchy and rows are leaves. Theijth element is leafi’s ancestors at levelj.
Interaction
To get a sense of how to navigate treelapse visualizations, click the demo video linked below.
References
The essential ideas behind the visualizations in this package come from these papers.
- Heer, Jeffrey, and Stuart K. Card. “DOITrees Revisited: Scalable, Space-Constrained Visualization of Hierarchical Data.” Proceedings of the Working Conference on Advanced Visual Interfaces, ACM, 2004, pp. 421–424.
- Hochheiser, Harry, and Ben Shneiderman. “Visual Queries for Finding Patterns in Time Series Data.” University of Maryland, Computer Science Dept. Tech Report, CS-TR-4365, 2002.
- Gómez, John Alexis Guerra, et al. “TreeVersity: Comparing Tree Structures by Topology and Node’s Attributes Differences.” Visual Analytics Science and Technology (VAST), 2011 IEEE Conference on, IEEE, 2011, pp. 275–276.
- Guerra-Gómez, John Alexis, et al. “Visualizing Change over Time Using Dynamic Hierarchies: TreeVersity2 and the StemView.” IEEE Transactions on Visualization and Computer Graphics, vol. 19, no. 12, IEEE, 2013, pp. 2566–2575.
The implementation hinges heavily on these (very nice) tools,
Contact
We need your help to improve this package. For bug reports and feature requests, either create an issue on github or email me.