To this point, we’ve only studied experiments with one factor of interest. How should we design experiments when there are several factors, all of interest?
This is the most common situation we encounter in practice, and the remainder of the course is going to be devoted to solutions to this problem, all based on the idea of factorial designs.
For example, consider,
- Battery life: An engineer wants to study how long a battery will last, as a function of temperature and material used in construction.
- Bottling: The fill height of a bottling machine depends on percent carbonation, operating pressure, and assembly line speed, but the precise relationship is currently unknown.
Visualizing Factorial Designs
- When we have two factors and a continuous response, we can visualize the relationship either in 3D, or from the top down.
- If the factor has only two levels, the possible configurations are corners square (hypercube, in higher dimensions).
- If it can vary continuously, we get a surface.
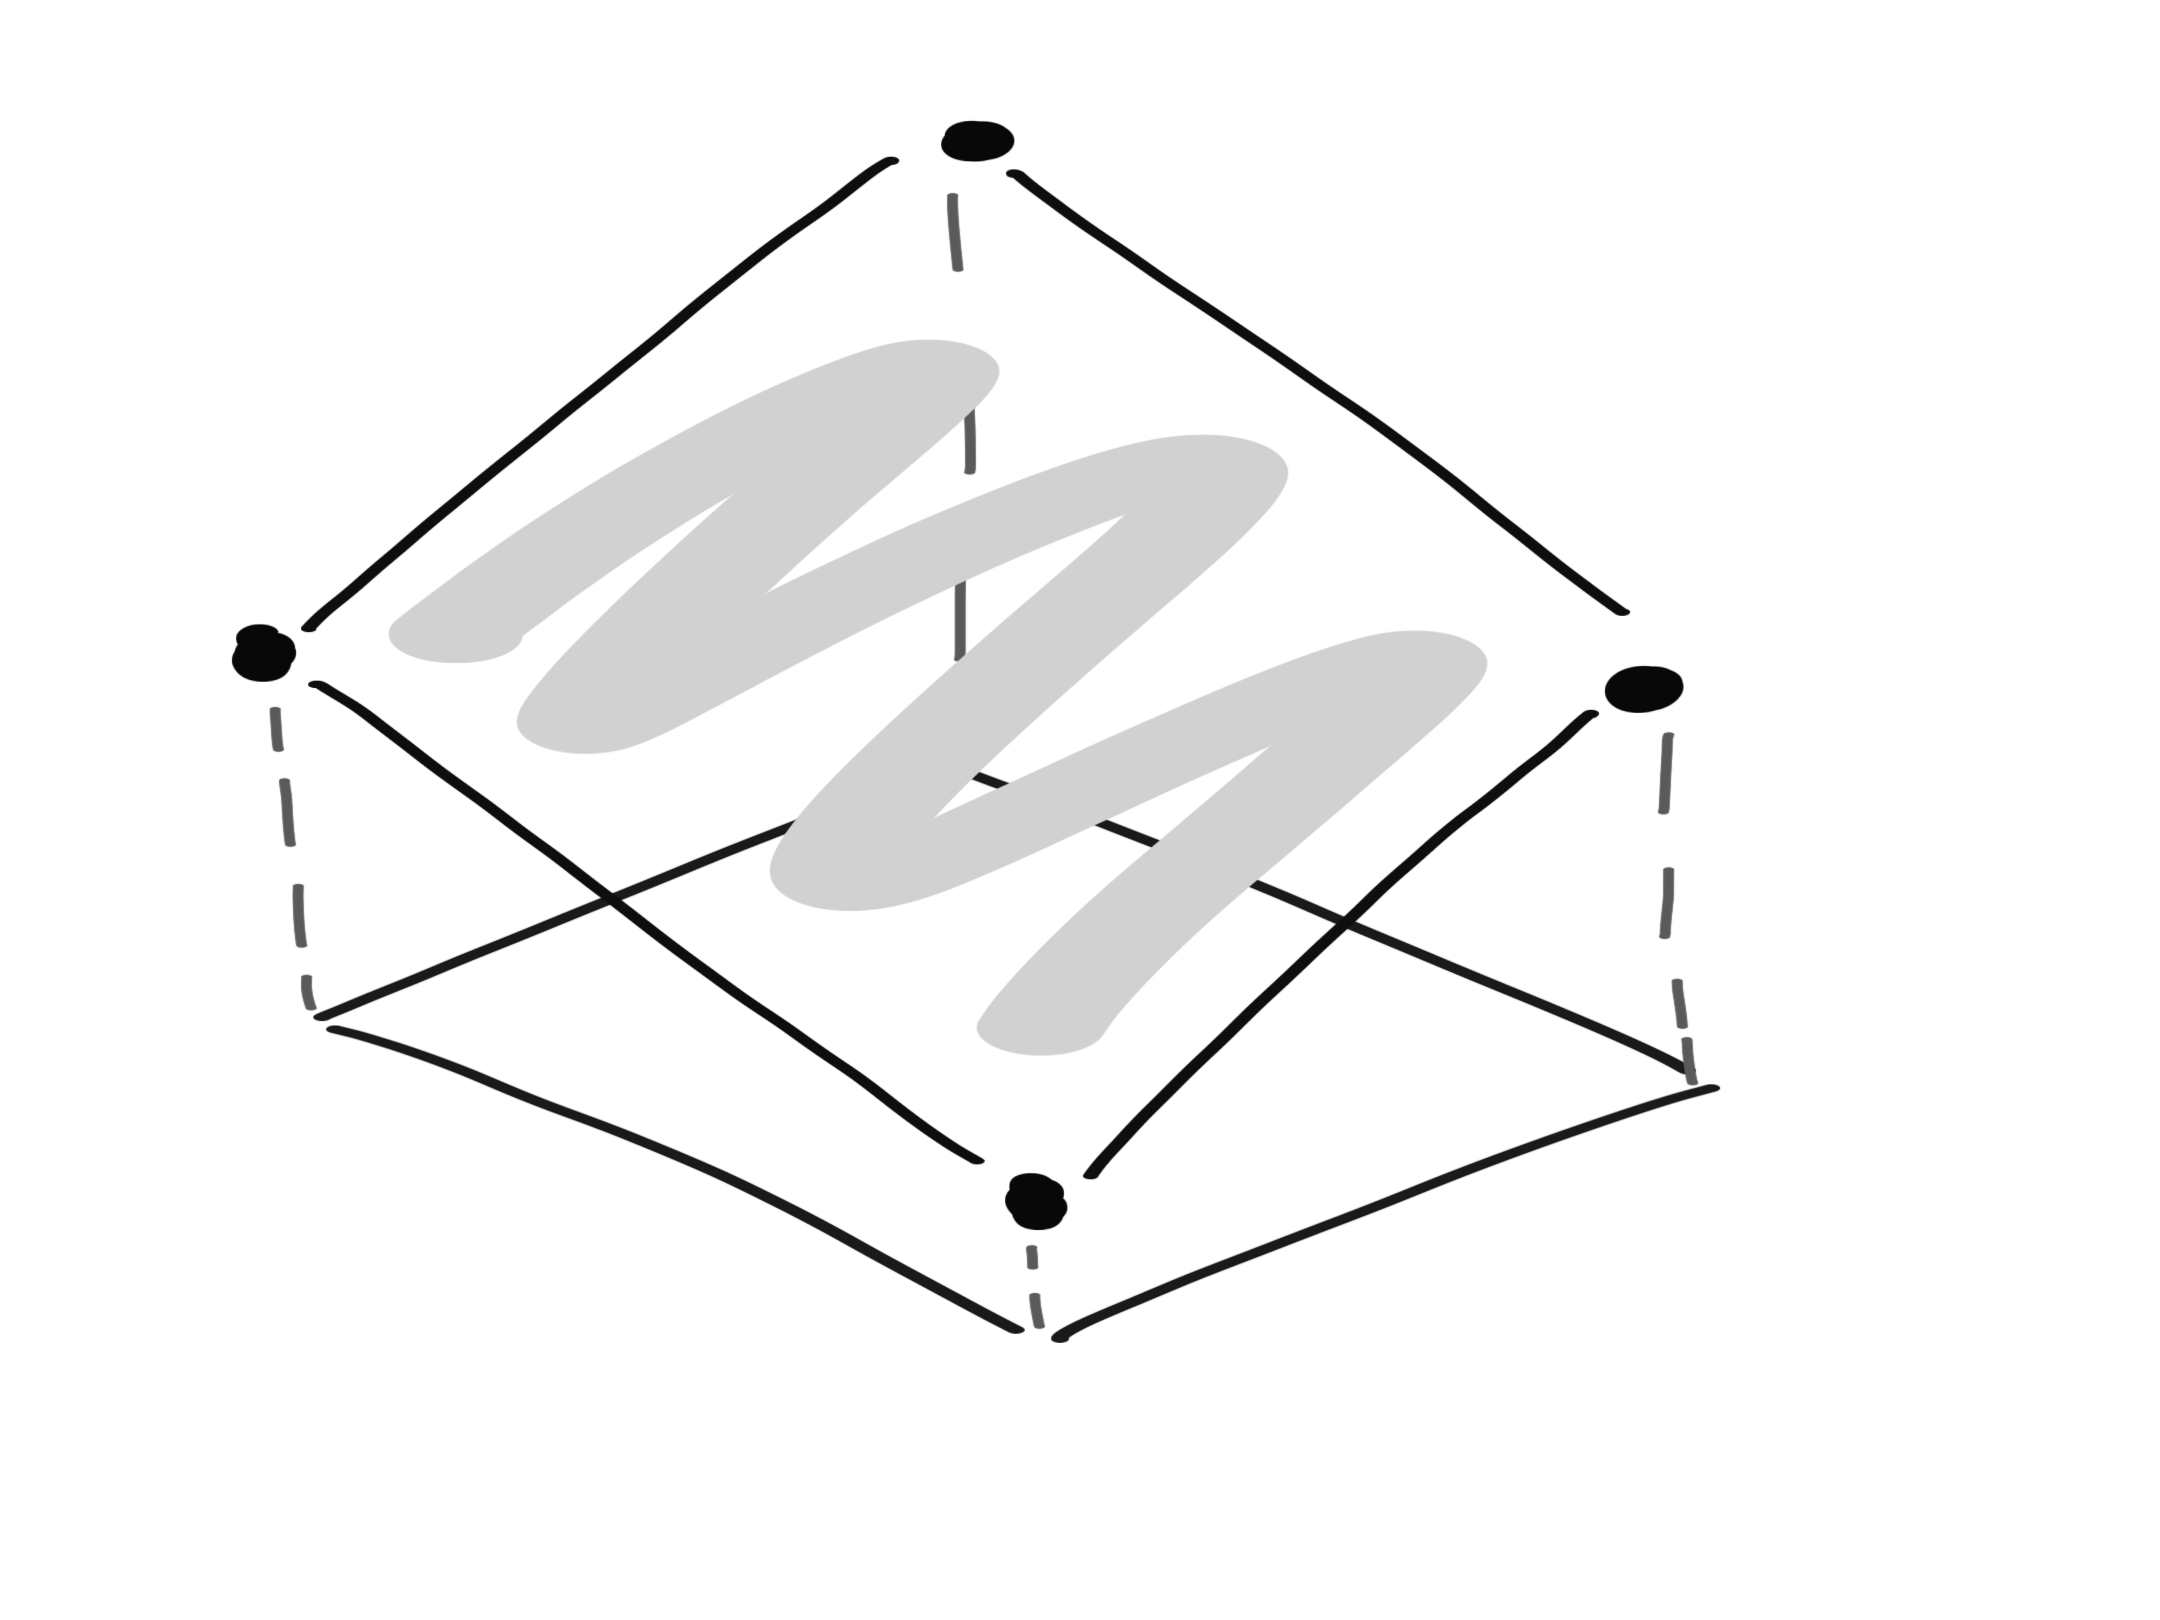
Figure 1: A two factor experiment viewed in 3D.
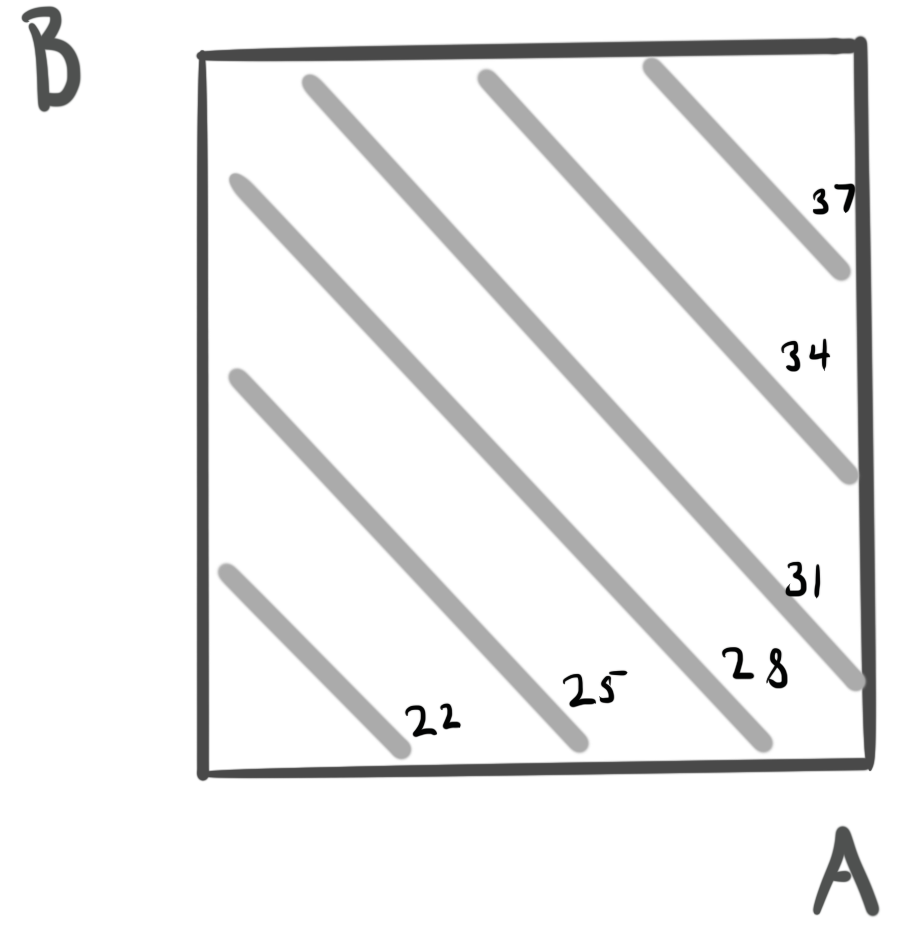
Figure 2: A two factor experiment viewed from the top down.
- When we have more than two factors, we have to pick a subset of factors to visualize at a time, and show multiple surfaces for each configuration of other factors.
Main and Interaction Effects
The main effect is defined as the average change in the response when increasing a factor by one unit, where the average is taken over values of all other factors
It’s possible that the change in response of one factor depends on the value of other factors. In this case, we say there is an interaction between the factor and the factors that cause changes in effect sizes.
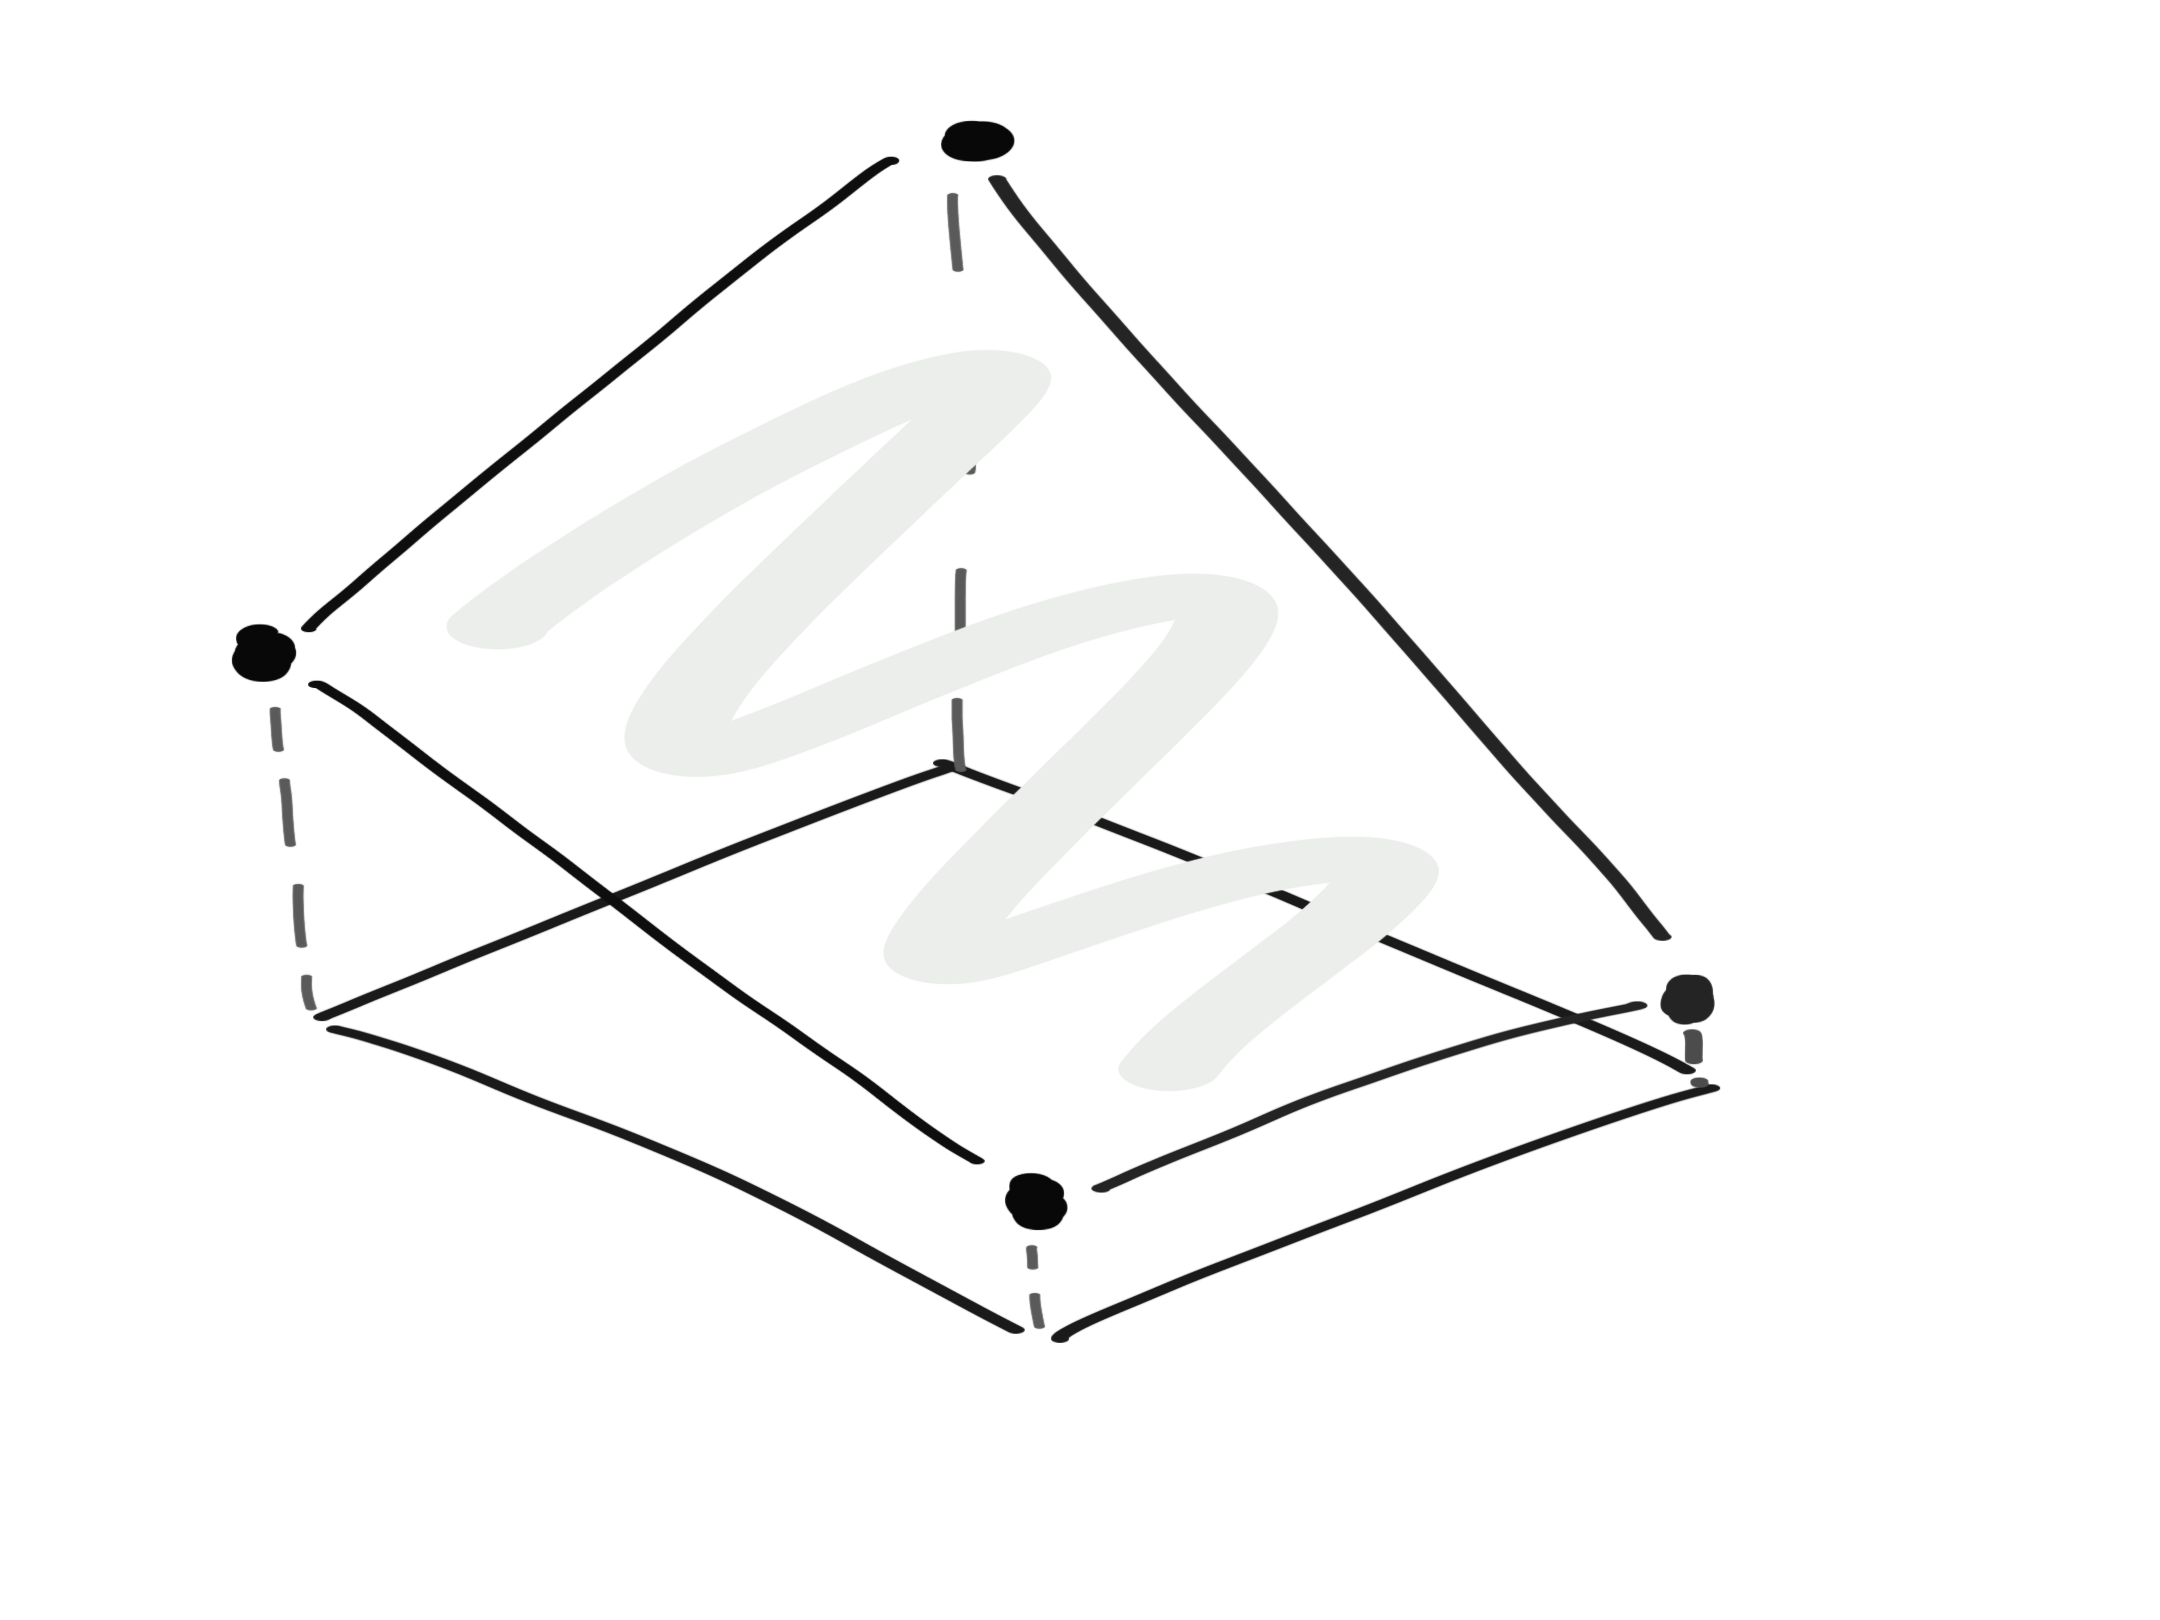
Figure 3: A two factor experiment with an interaction effect, viewed in 3D
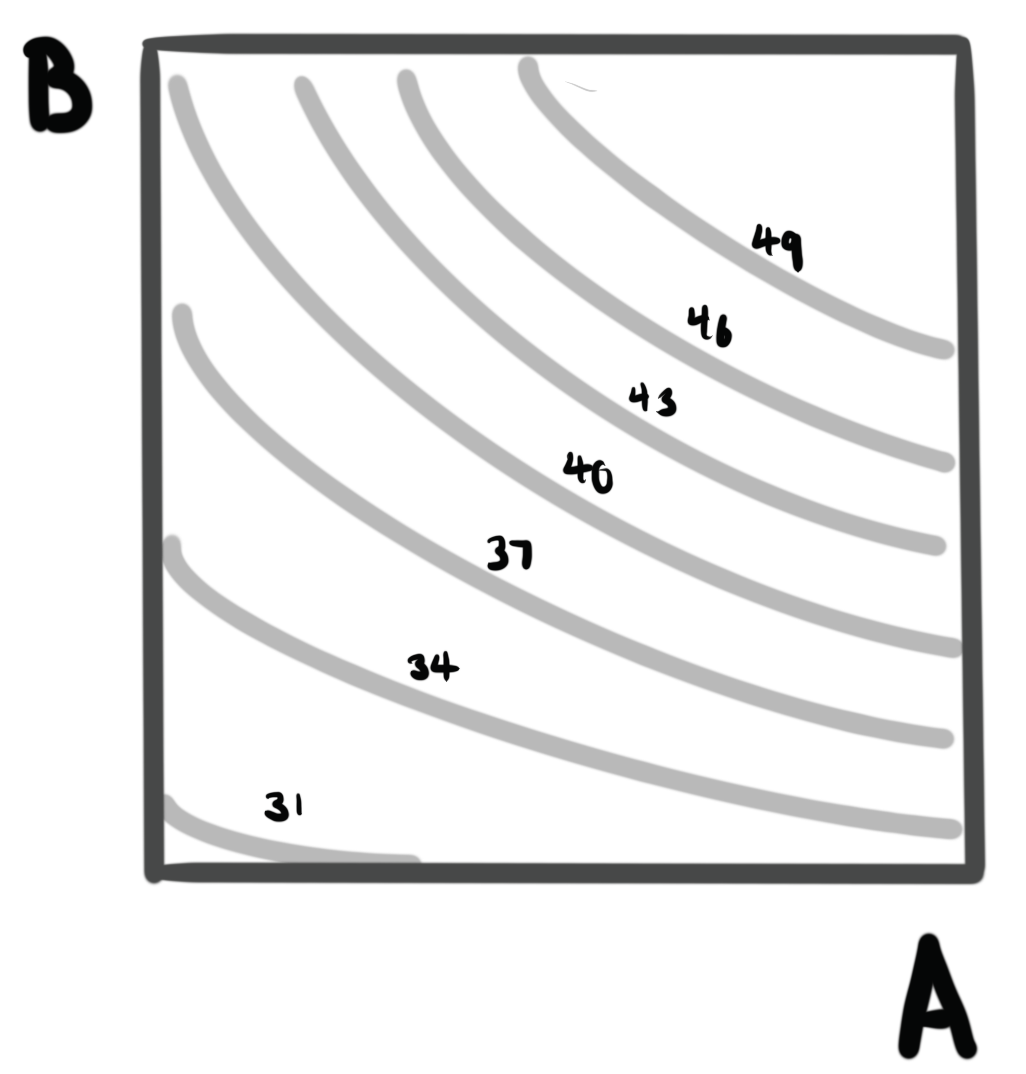
Figure 4: A two factor experiment with an interaction effect, viewed from the top down
- We can encode an interaction through a regression equation \[
y = \beta_0 + \beta_1 x_1 + \beta_2 x_2 + \beta_{12} x_{1} x_{2}
\]
- When \(\beta_{12}\) is nonzero, there is an interaction between \(x_1\) and \(x_2\).
- In this case, the slopes of \(x_1\) and \(x_2\) are not fixed, and each depends on the value of the other variable.