Visualization Portfolio - STAT 479 Spring 2022

2014 - 2015 Basketball Shots
Author: Jack Chen
Click here to visit the interactive app.
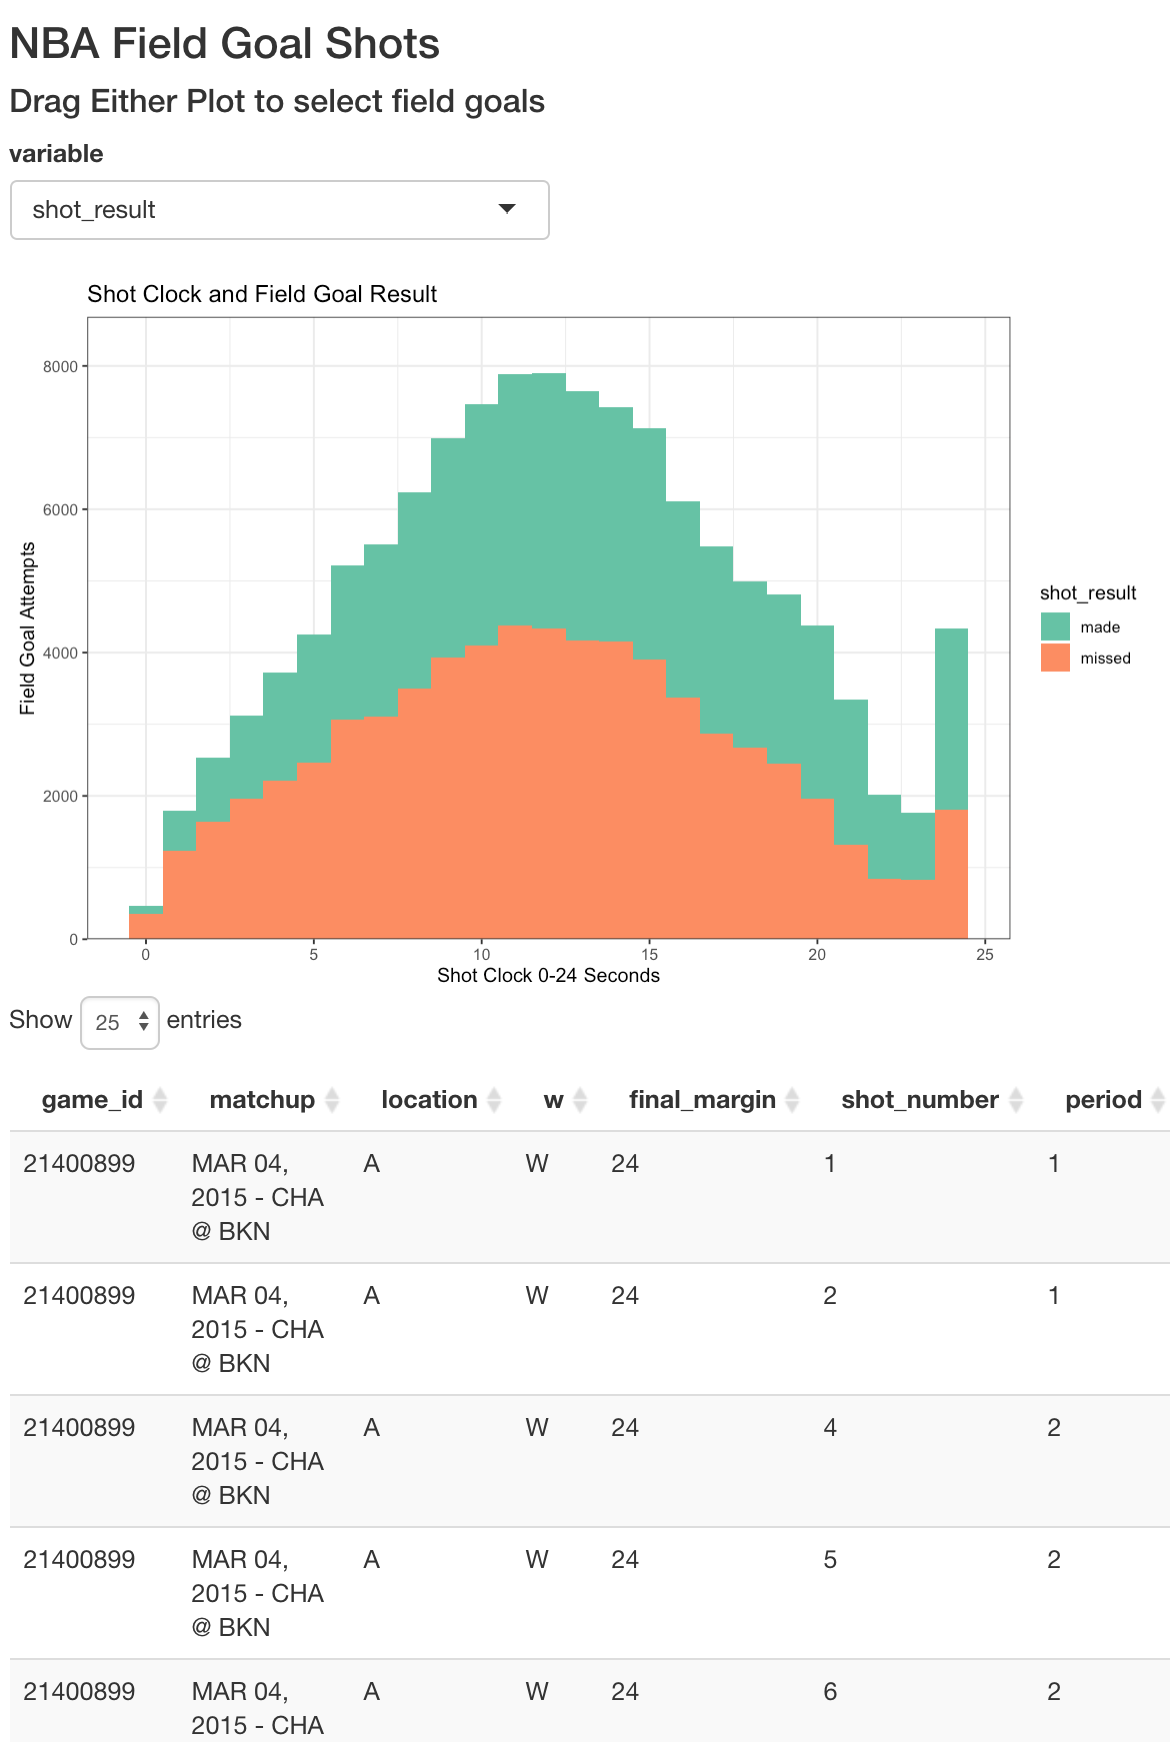
This personal portfolio presents a visualization of the Data on shots taken during the 2014-2015 season. The main graphs are the shot clock and field goal Results showing the remaining shot clock and the shot attempts in every second remaining with the color differentiating the made and miss outcome. The second graph shows the shot distance and the defender’s distance having the decision on differentiating the shot by their points type or shot result. The remaining graphs show the shot distance density and the count of shots by points type for your information.