Visualization Portfolio - STAT 479 Spring 2022
Incorporation and Population
Author: Yunzikai Chen
Click here to visit the interactive app.
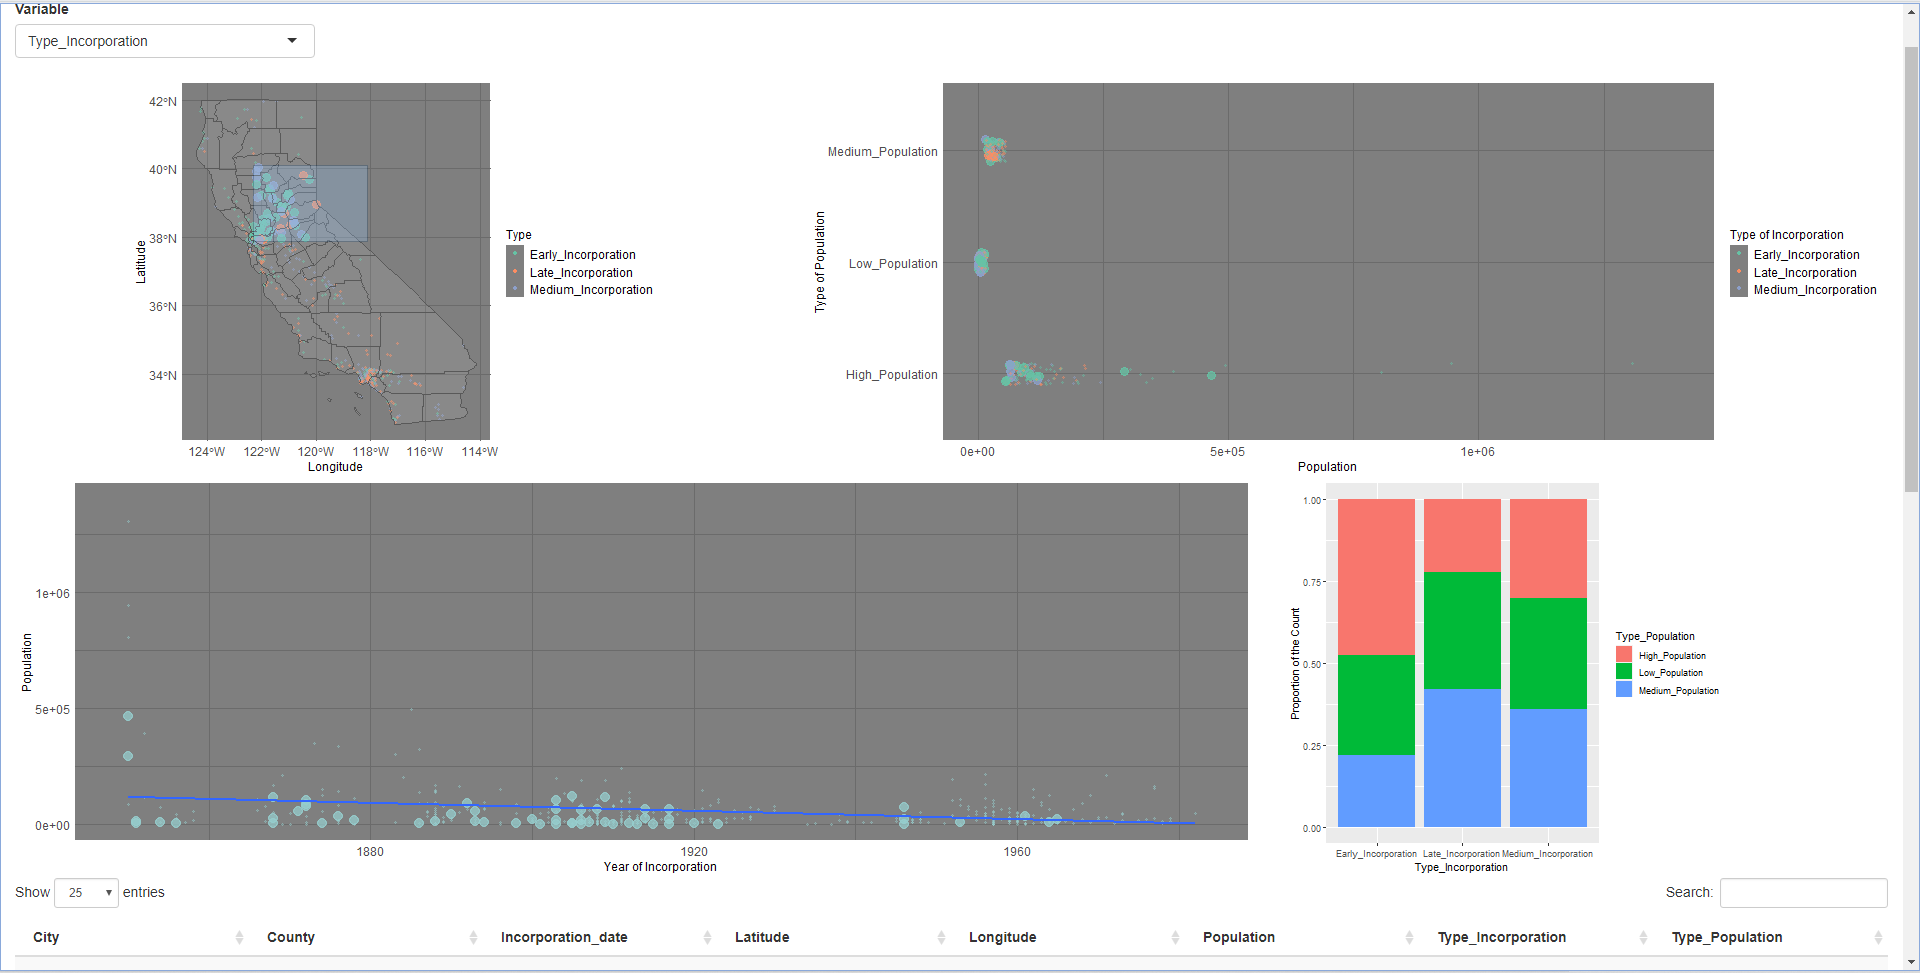
The datasets I selected for this portfolio are the geographic location and the population of California cities, and I hope to help people who want to settle in California in the future find suitable cities according to their different preferences for factors such as geographic location, year of incorporation, and population. Regarding the visualization, I applied the linked brushing to create two scatterplots of geographic location and regression and one point plot, and there’s also a static bar plot. The plots show that there is a slight negative correlation between the year of incorporation and population.