Visualization Portfolio - STAT 479 Spring 2022

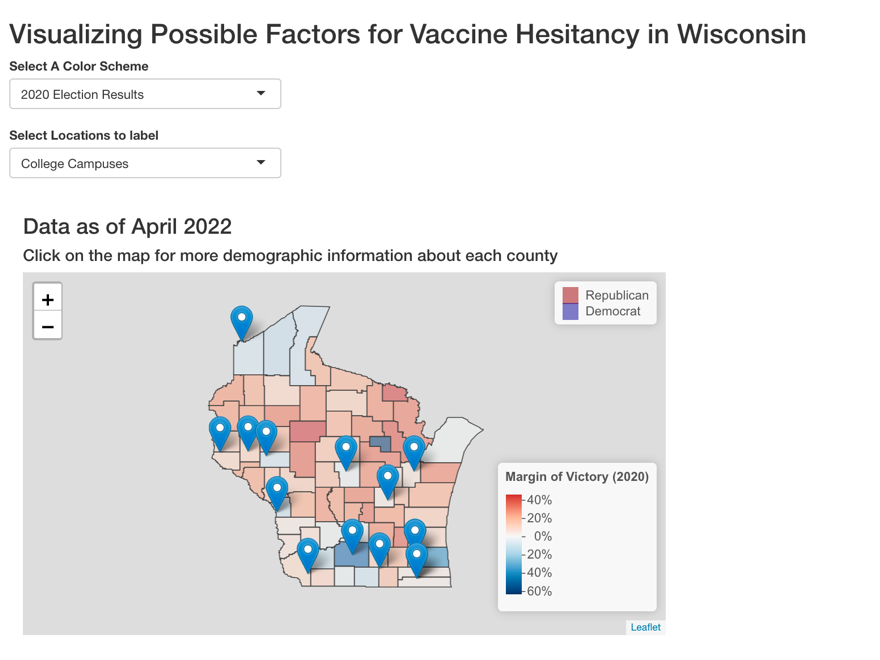
Possible Factors for Vaccine Hesitancy in Wisconsin
Author: Michael Kornley
Click here to visit the interactive app.
This interactive spatial visualization tries to help viewers understand what metrics are factoring into people not getting vaccinated in the state of Wisconsin. This Leaflet allows you to interact with each county, colored by either the 2020 election results or COVID Vaccination data, to get more demographic information that may or may not factor into the decision to get vaccinated.