Visualization Portfolio - STAT 479 Spring 2022
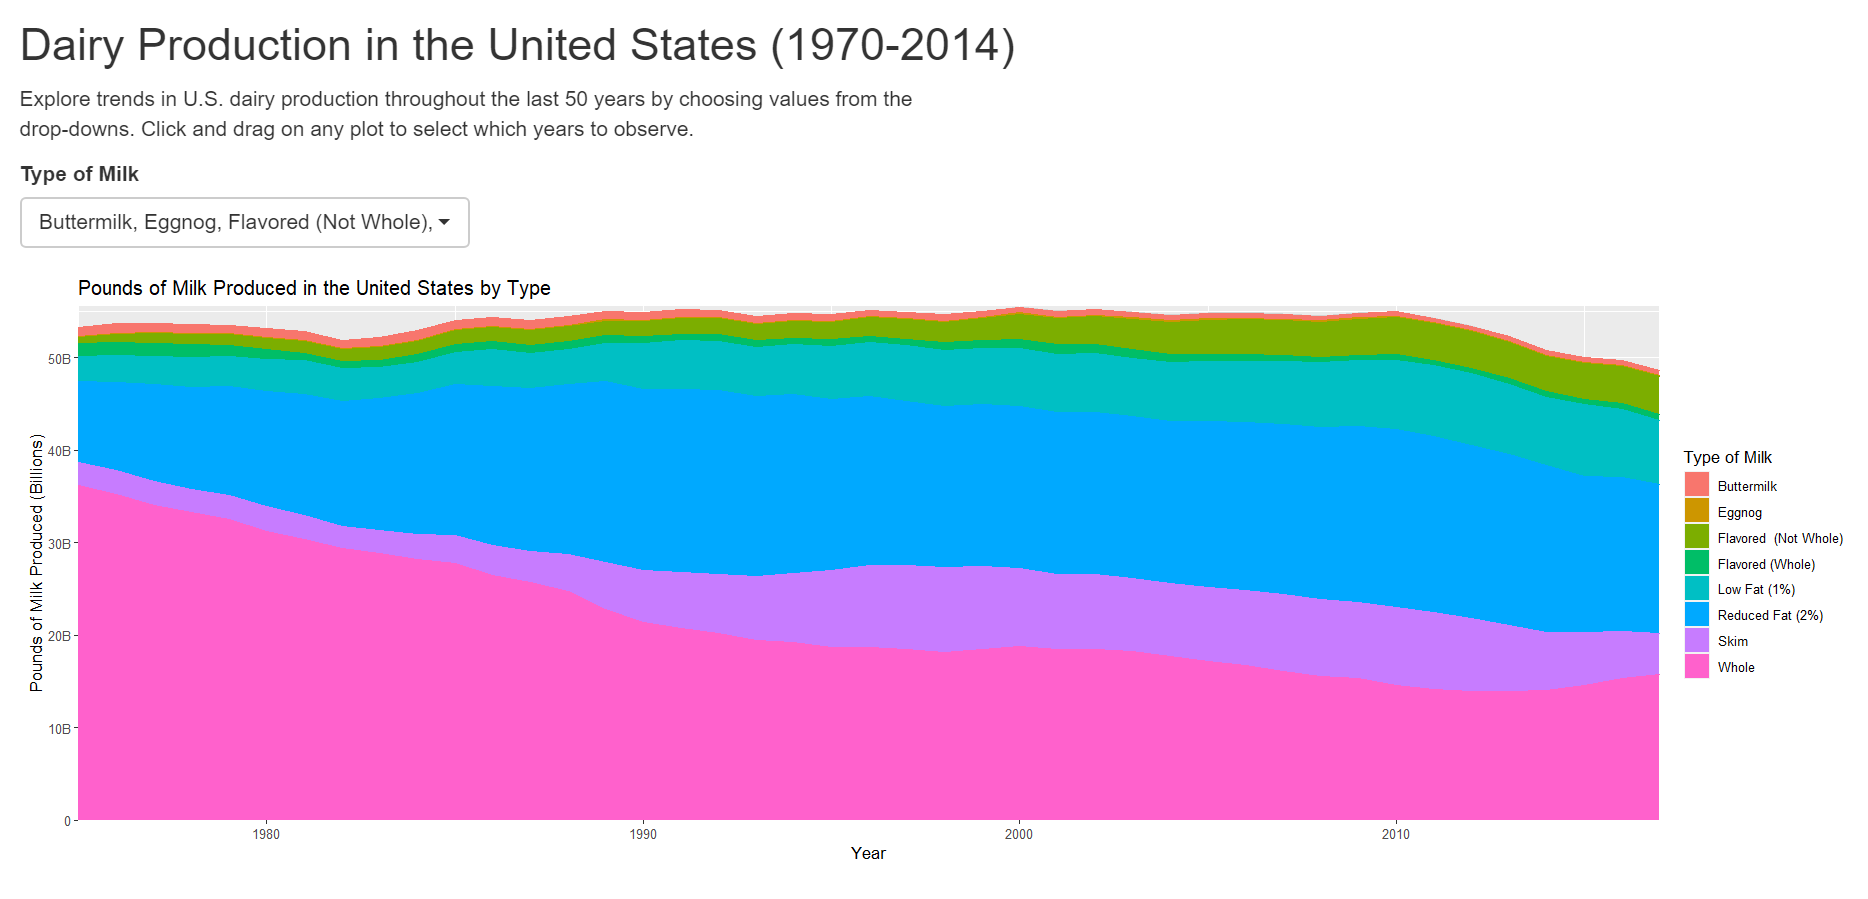
Dairy Production in the United States (1970-2014)
Author: Mikayla Lamping
Click here to visit the interactive app.
This project is an interactive visualization of trends in the United States’ milk production throughout the past 50 years. Its intent is to allow users to explore how various factors relating to milk production have changed over time to gain a better understanding of the milk industry.