Visualization Portfolio - STAT 479 Spring 2022
US Beer Production
Author: Jonathan Hansen
Click here to visit the interactive app.
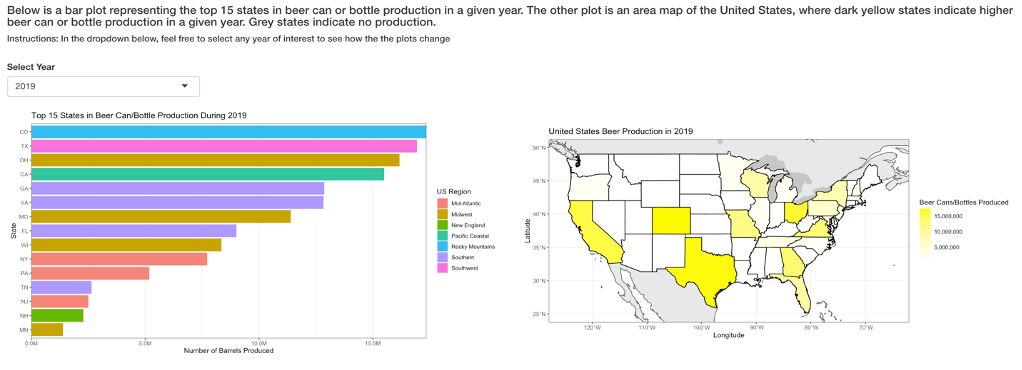
This application aims to visualize yearly beer production, both in cans and bottles, across 48 US states (DC, HI, AL removed) from 2008-2019. Users can select any year of interest, from 2008- 2019, to see both the top-15 beer-producing states, as well as the beer production of all continental US states on a US map.