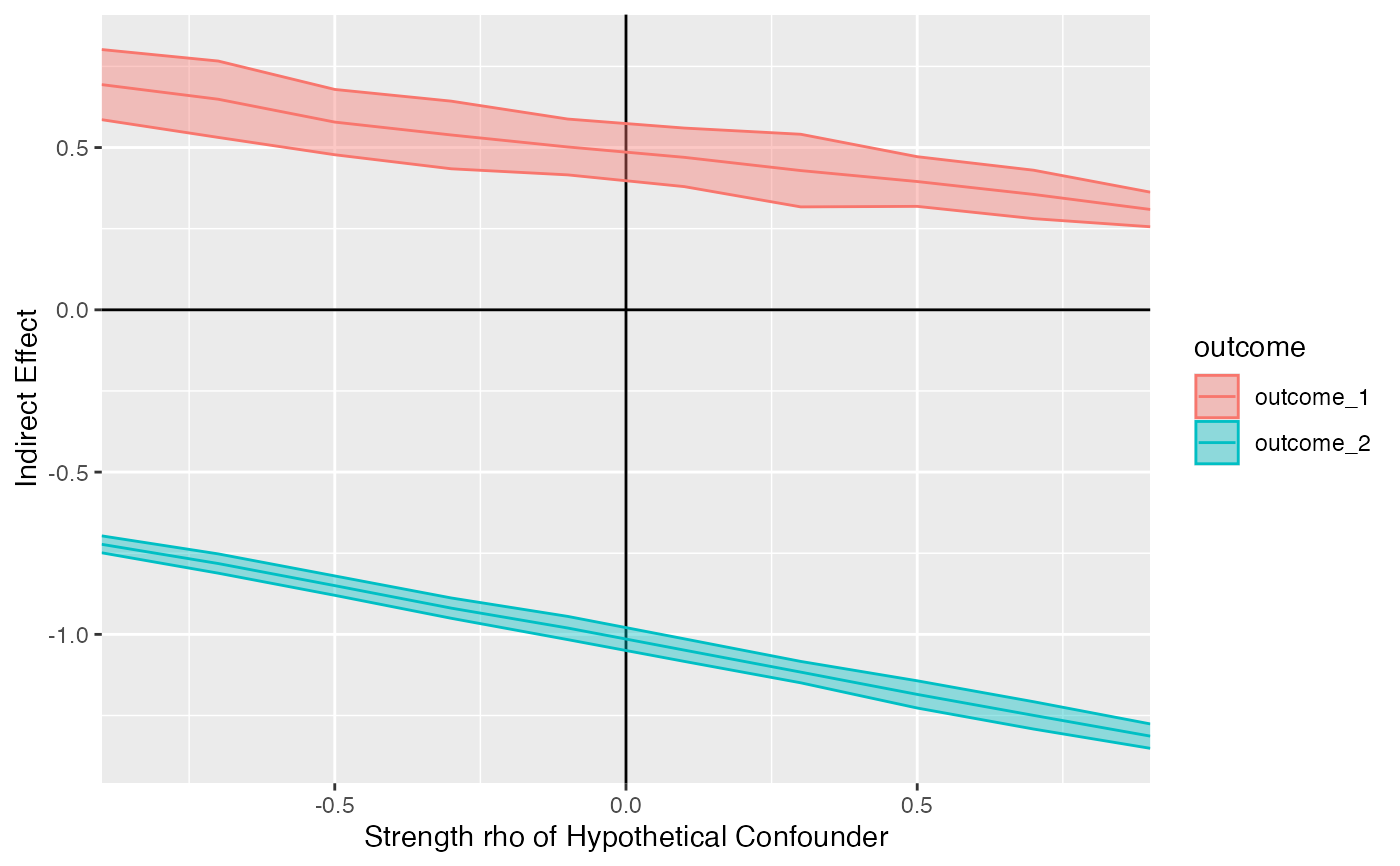
This function draws a curve of indirect effect against the sensitivity parameter, allowing users to specify the name of x and y-axis variables using the x_var and y_var inputs.
Arguments
- sensitivity_curve
The output of a call to sensitivity or sensitivity_perturb. A data.frame whose columns are: outcome, {x_var}, {y_var}, and {y_var}_standard_error, where x_var and y_var are defined in the two arguments below.
- x_var
The type of perturbation variable to plot along the x-axis. Defaults to "rho", following the sensitivity approach implemented in sensitivity_subset.
- y_var
The type of effect to plot along the y-axis. Defaults to indirect_effect.

