Interface Design and Topic Models
The Stanford Dissertation Browser case study
-
For most of the course, we have focused on visualizing the data directly. For the last few weeks, though, we have visualized the results of an initial modeling step, like fitting PCA or topic models. These kinds of models can help in creating abstractions, and reasoning effectively through abstraction is often a source of discovery.
-
The ideal is to apply modeling to lift concrete datasets into more meaningful abstractions, which can then be visualized to support high-level reasoning. Reality, however, is rarely as simple is that. In practice, models can go awry, visualizations can be misleading, and results can be misunderstood. Indeed, this complexity is one of the reasons data science training takes years.
-
The authors of this week’s reading suggest a mnemonic: “interpret but verify.” This captures several principles,
- Interpret: Models and visualizations should be designed in such a way that users can draw inferences that are relevant to their understanding of a domain.
- Verify: It is the designer’s responsibility that these inferences be accurate.
Stanford Dissertation Browser
-
The authors ground their discussion by considering a specific design project: The Stanford Dissertation Browser. For this project, university leadership wanted to discover ways to promote effective, interdisciplinary research. Topic models helped transform the the raw dissertation text data into higher-levels of abstraction. Research themes were reflected in topics, and the interdisciplinary reach of certain PhD theses was reflected in their mixed-memberships.
-
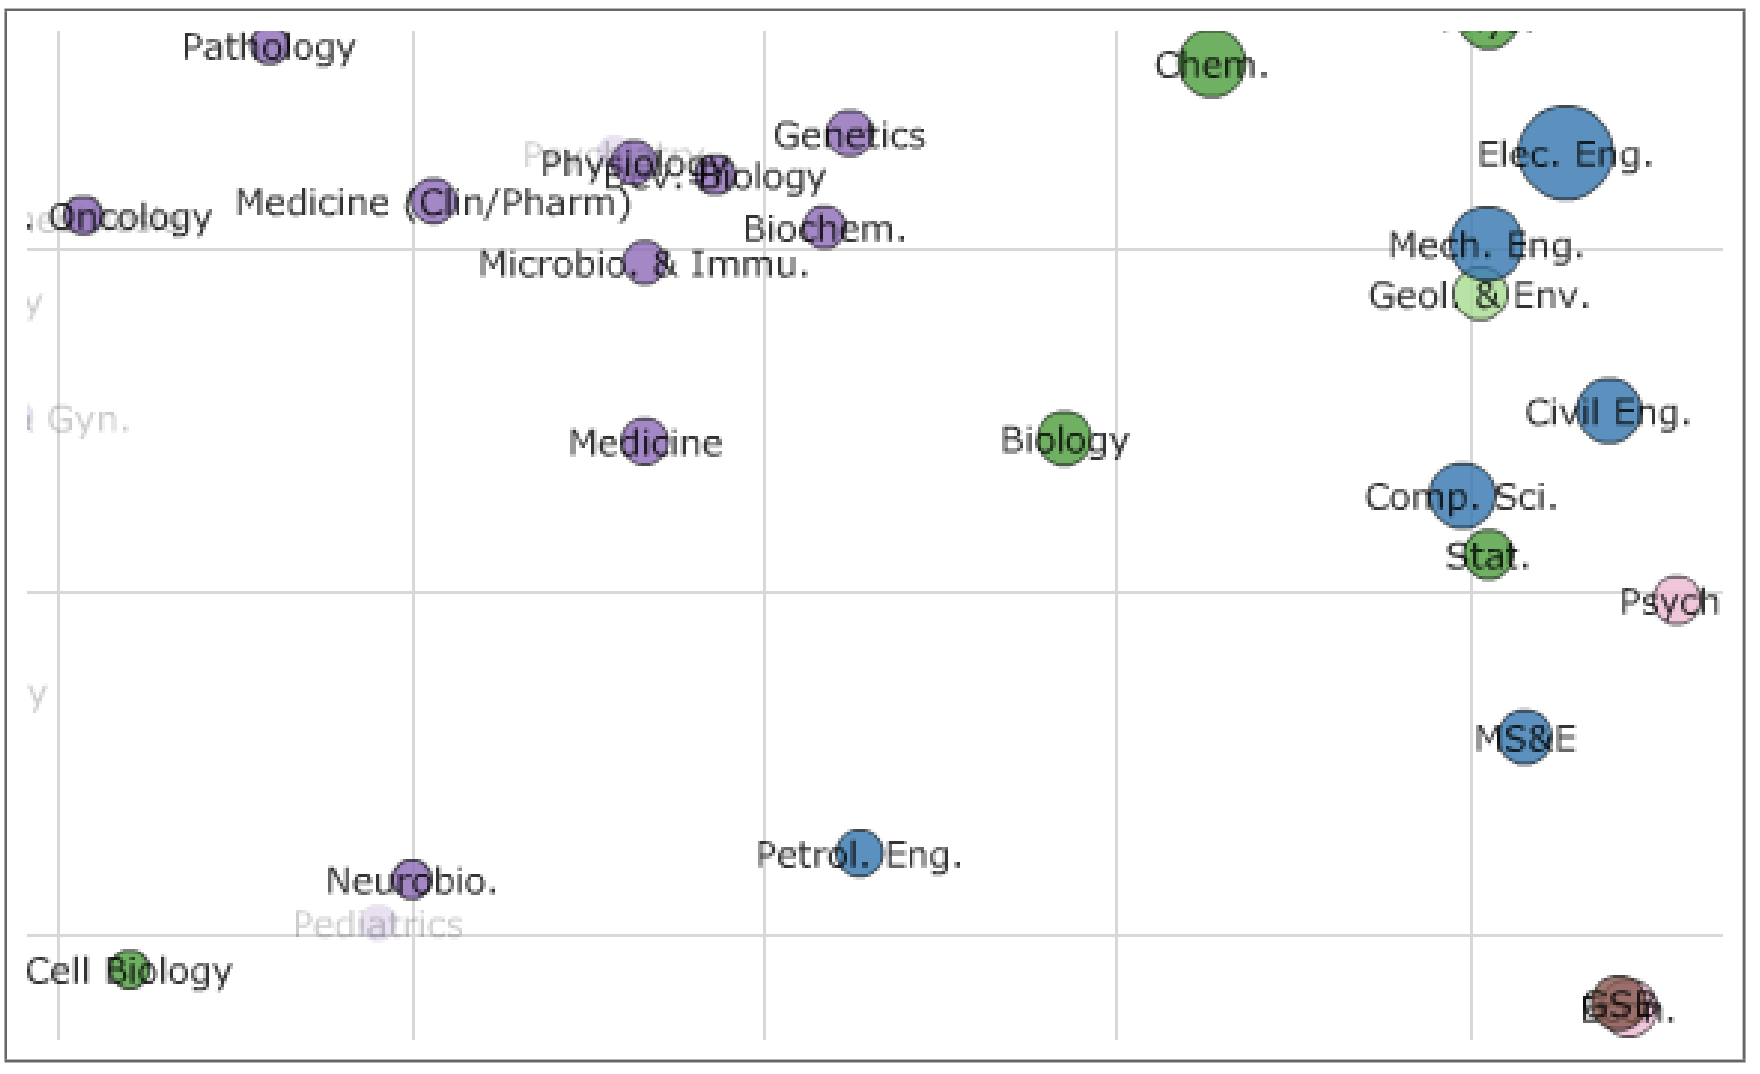
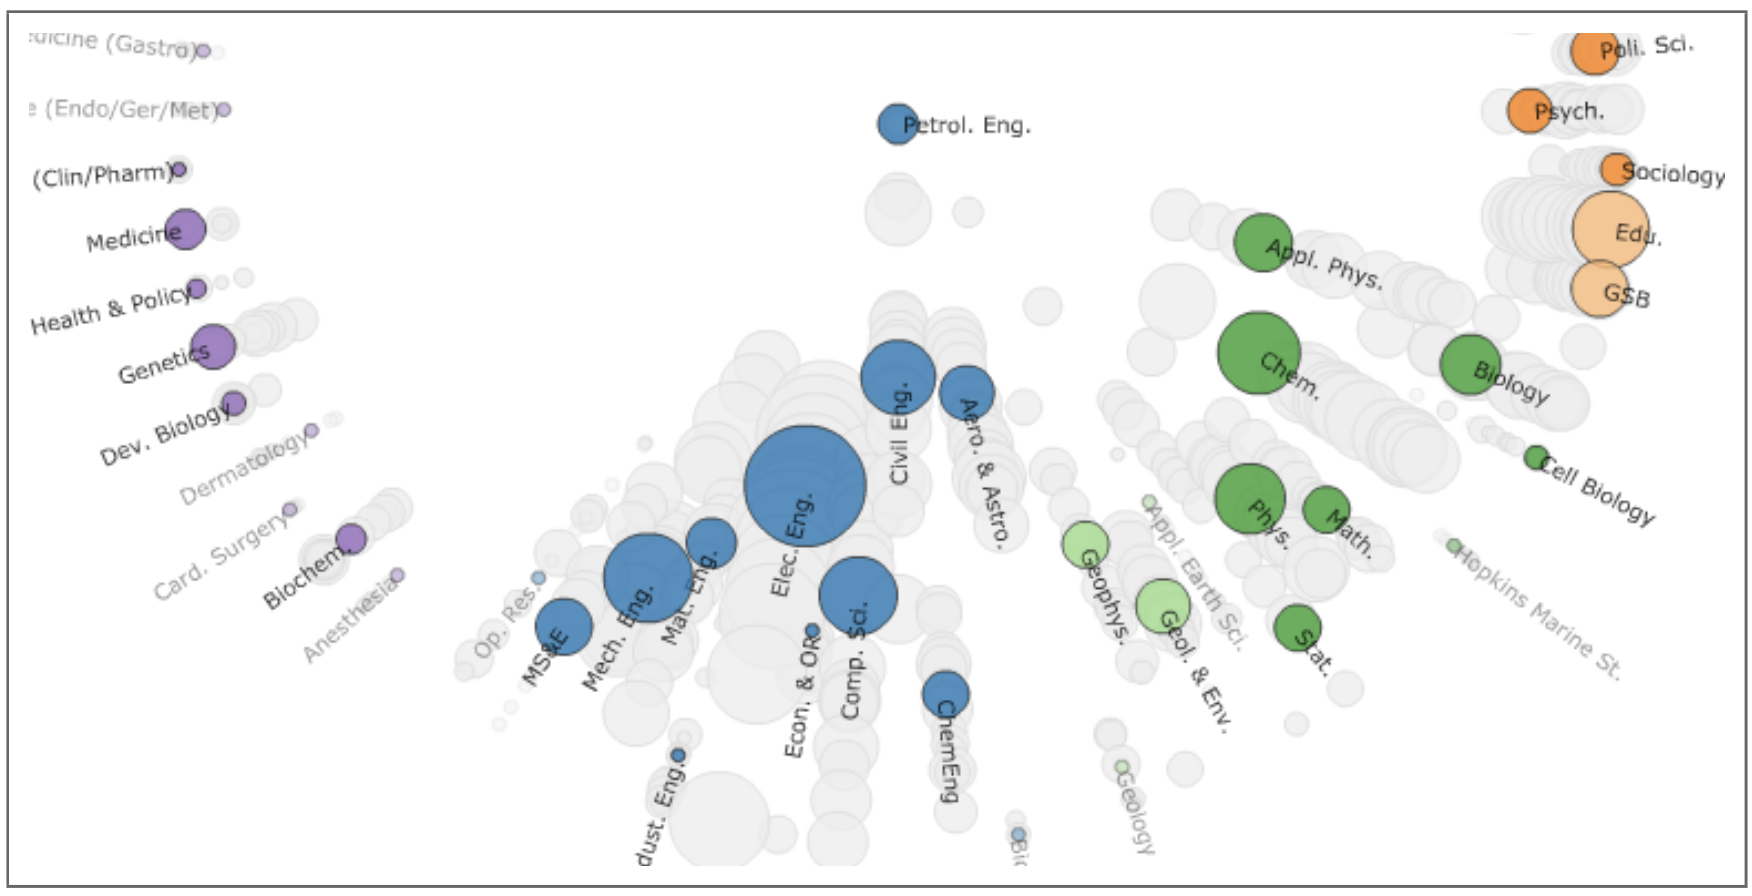
In several initial implementations of their interface, it was easy to draw incorrect inferences. For example, in some dimensionality-reduction outputs, it seemed that petroleum engineering had become closer to biology over time, but this turned out to be an artifact of the reduction and was not visible when using the original distances. Another example — some words were used in neurobiology (voltage, current, …) led to theses in this department to appear very close to electrical engineering, when they really had more in common with those in other biology departments.
-
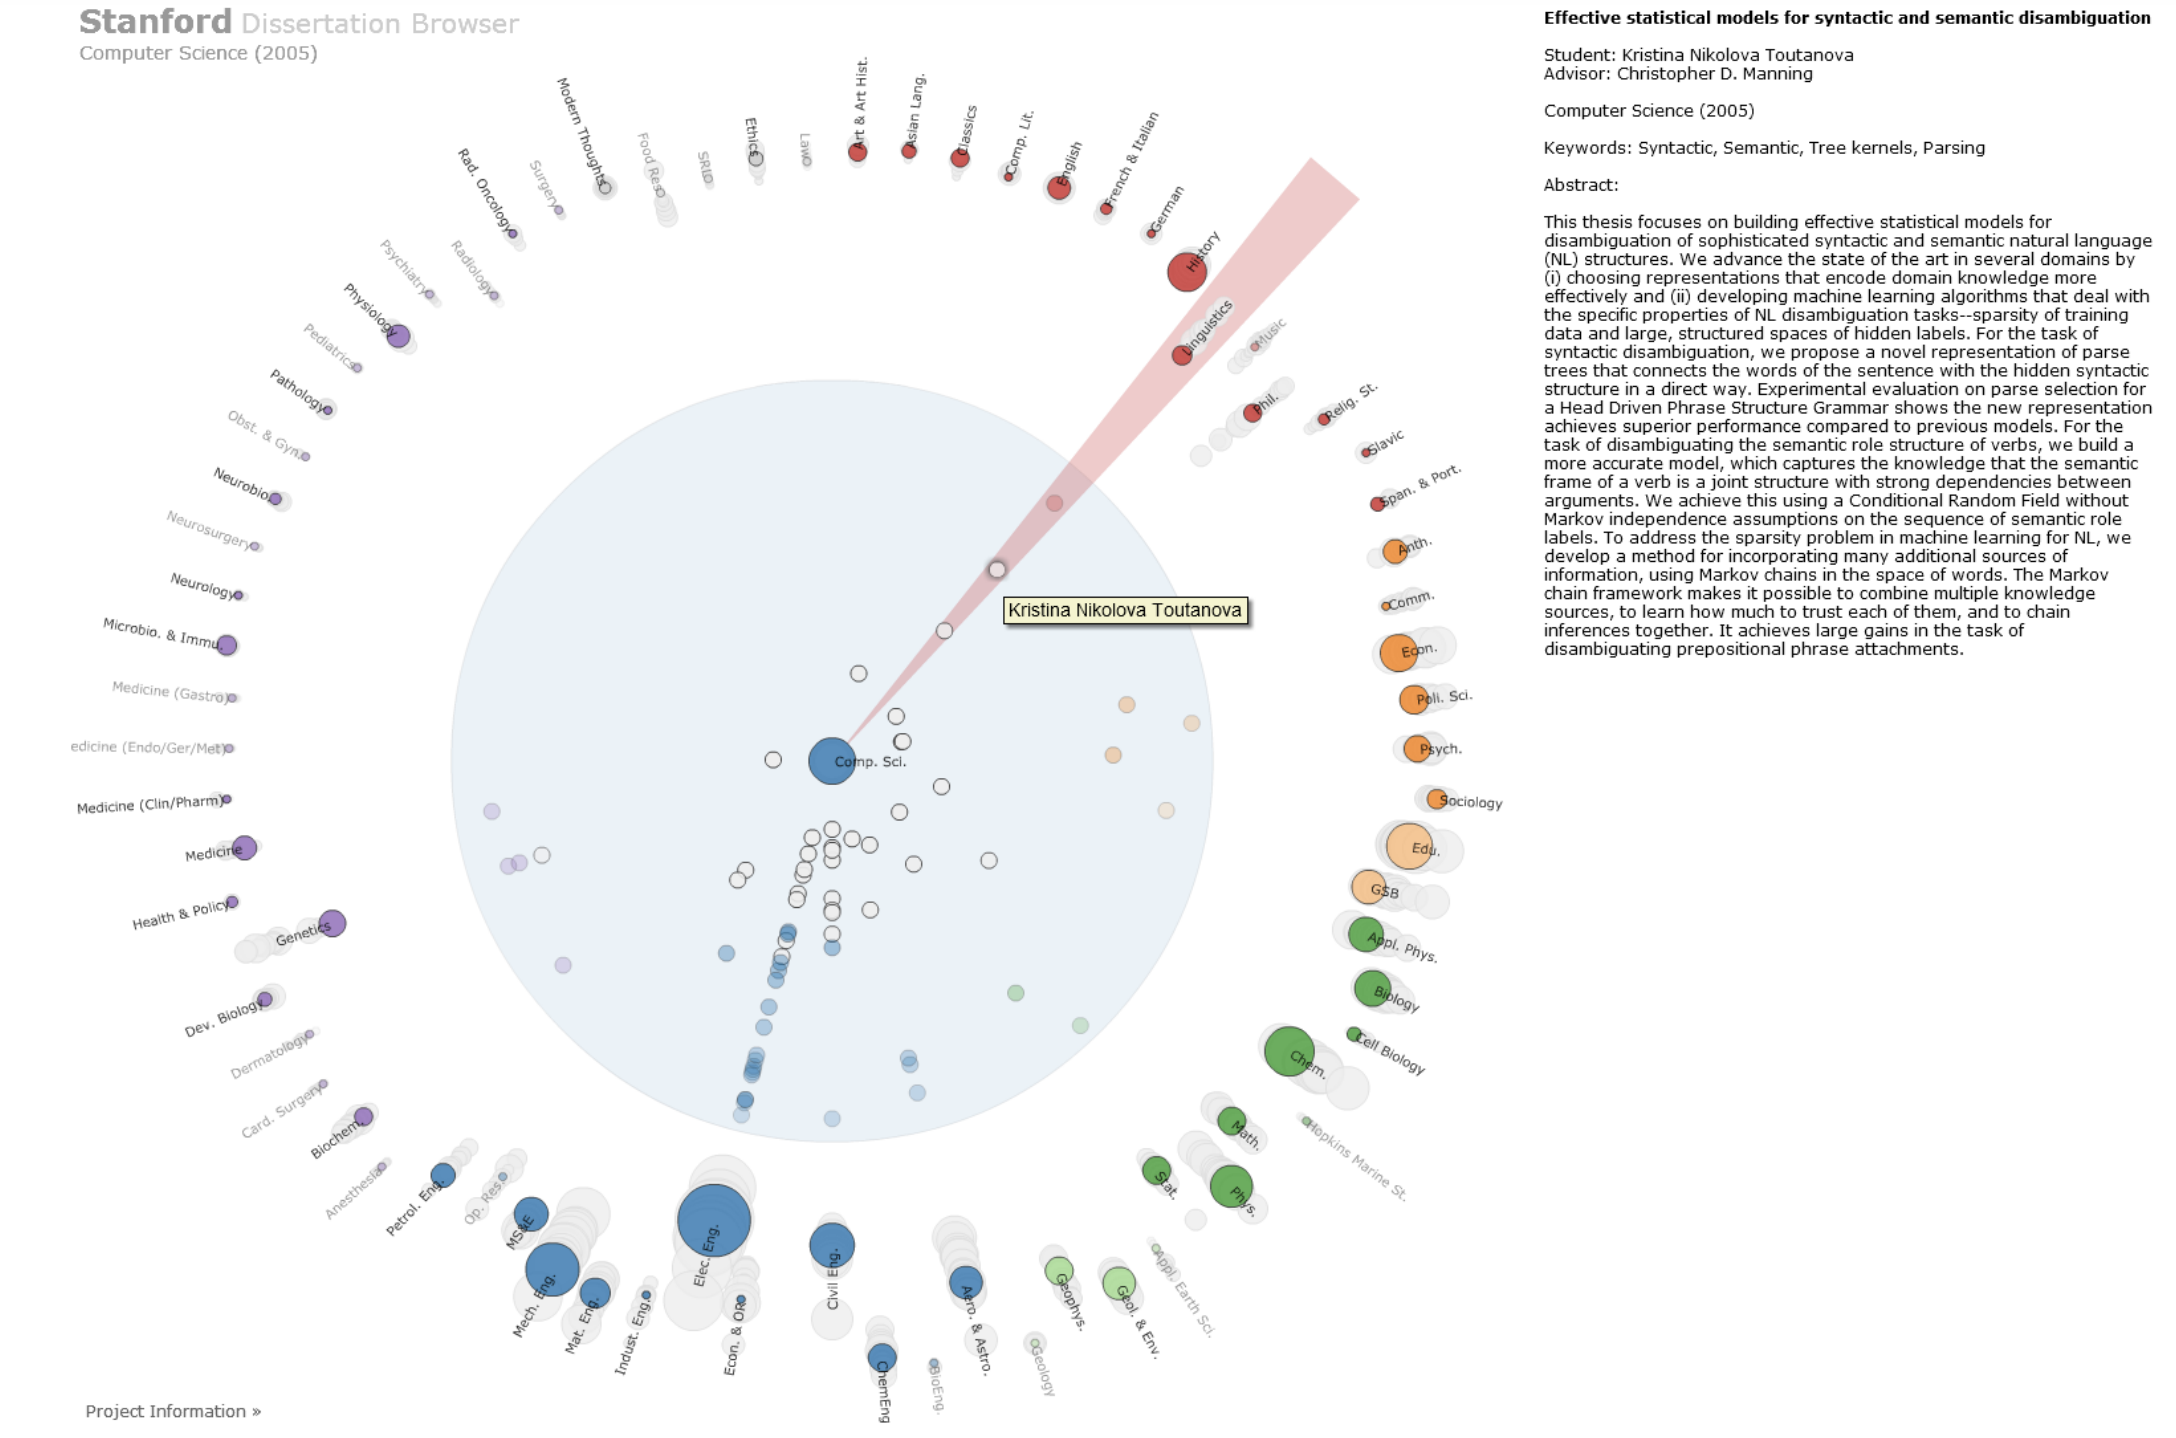
The authors carefully tracked and manually verified inferences made by a group of test users. Based on this qualitative evaluation, they were able to refine their modeling and visualization approach. For example, they used a supervised variant of topics models, and they replaced their original dimensionality reduction scatterplot with a visualization of topic-derived inter-department similarities.
Overall Strategy
-
To implement the “interpret but verify” idea, the authors recommend,
- Align the analysis, visualization, and models along appropriate “units of analysis.”
- Verify that the modeling results in abstractions / concepts that are relevant to the analysis, and modify accordingly.
- Progressively disclose data to support reasoning at multiple levels of abstraction.
-
The units of analysis in the dissertation browser were departments and theses. In general, these are the “entities, relationships, and concepts” of interest, and they can often linked to existing metadata.
-
Verification can be guided both by quantitative metrics (e.g., test error) and qualitative evaluation (e.g., user studies). For revising models, it can be possible to refit parameters, add labels, modify model structure, or simply override the model with user-provided values.
-
Progressive disclosure allows the user to go up and down the ladder of abstraction. It makes it possible to navigate large-scale data while supporting verification through specific examples.
-
In the dissertation browser, this is implemented through semantic zooming (from departmental to dissertation views) and linked highlighting (revealing the dissertation abstract on mouseover).
-
The question of how to effectively weave together model building with visual design is still one that is actively explored in research today. If you enjoyed reading about this project, you may enjoy other papers on visualization for topic models or machine learning [1, 2, 3] more generally.