Interactivity in Dimensionality Reduction
Guiding dimensionality reduction through user inputs
-
In the academic literature, dimensionality reduction methods are usually presented with an algorithmic focus. However, in practice, there is often a strong human element in the application of these methods, since their value lies in the qualitative interpretations that they support. With this in mind, we should try to understand how interactivity can be used in the dimensionality reduction context. Naturally, all of the techniques we’ve studied in this class for interacting with scatterplots (e.g., dynamic linking) apply to dimensionality reduction results.
-
For example, here is an interactive version of the UMAP from the example in the previous notes. A brush can be used to retrieve sample details.
-
A less obvious idea is that interactivity can guide the application or refinement of the dimensionality reduction itself. For example, it can be used to filter the data that are input to the dimensionality reduction. More generally, the input data may be the result of a complex preprocessing pipeline, and parameters of that pipeline can be interactively adjusted.

For example, in dimensionality reduction of temporal data, we may first want to compute a sliding window average over time, and the widths of the windows can be chosen interactively. For each choice of window width, the dimensionality reduction scatterplot can be regenerated.
-
Some systems allow users to interactively label observations into classes — this is especially common when the ultimate goal of the data science system is to support classification. Certain dimensionality reduction methods (though not the ones we discussed in class) can incorporate these class labels, and so can be recomputed each time the user labels a subset of points.
-
Rather than interacting with the observations, we can interact with the features. For example, the PCA loadings define derived features. By interactively adjusting the values of these loadings, we can examine how the dimensionality reduction would change when the derived features are manually refined.

-
It’s also possible to interactively select between several competing dimensionality reduction methods. This can be done using a measure of dimensionality reduction quality, like the effectiveness with which known clusters are separated. However, among all the types of interactivity for dimensionality reduction techniques, this is among the rarest that is implemented in practice.
-
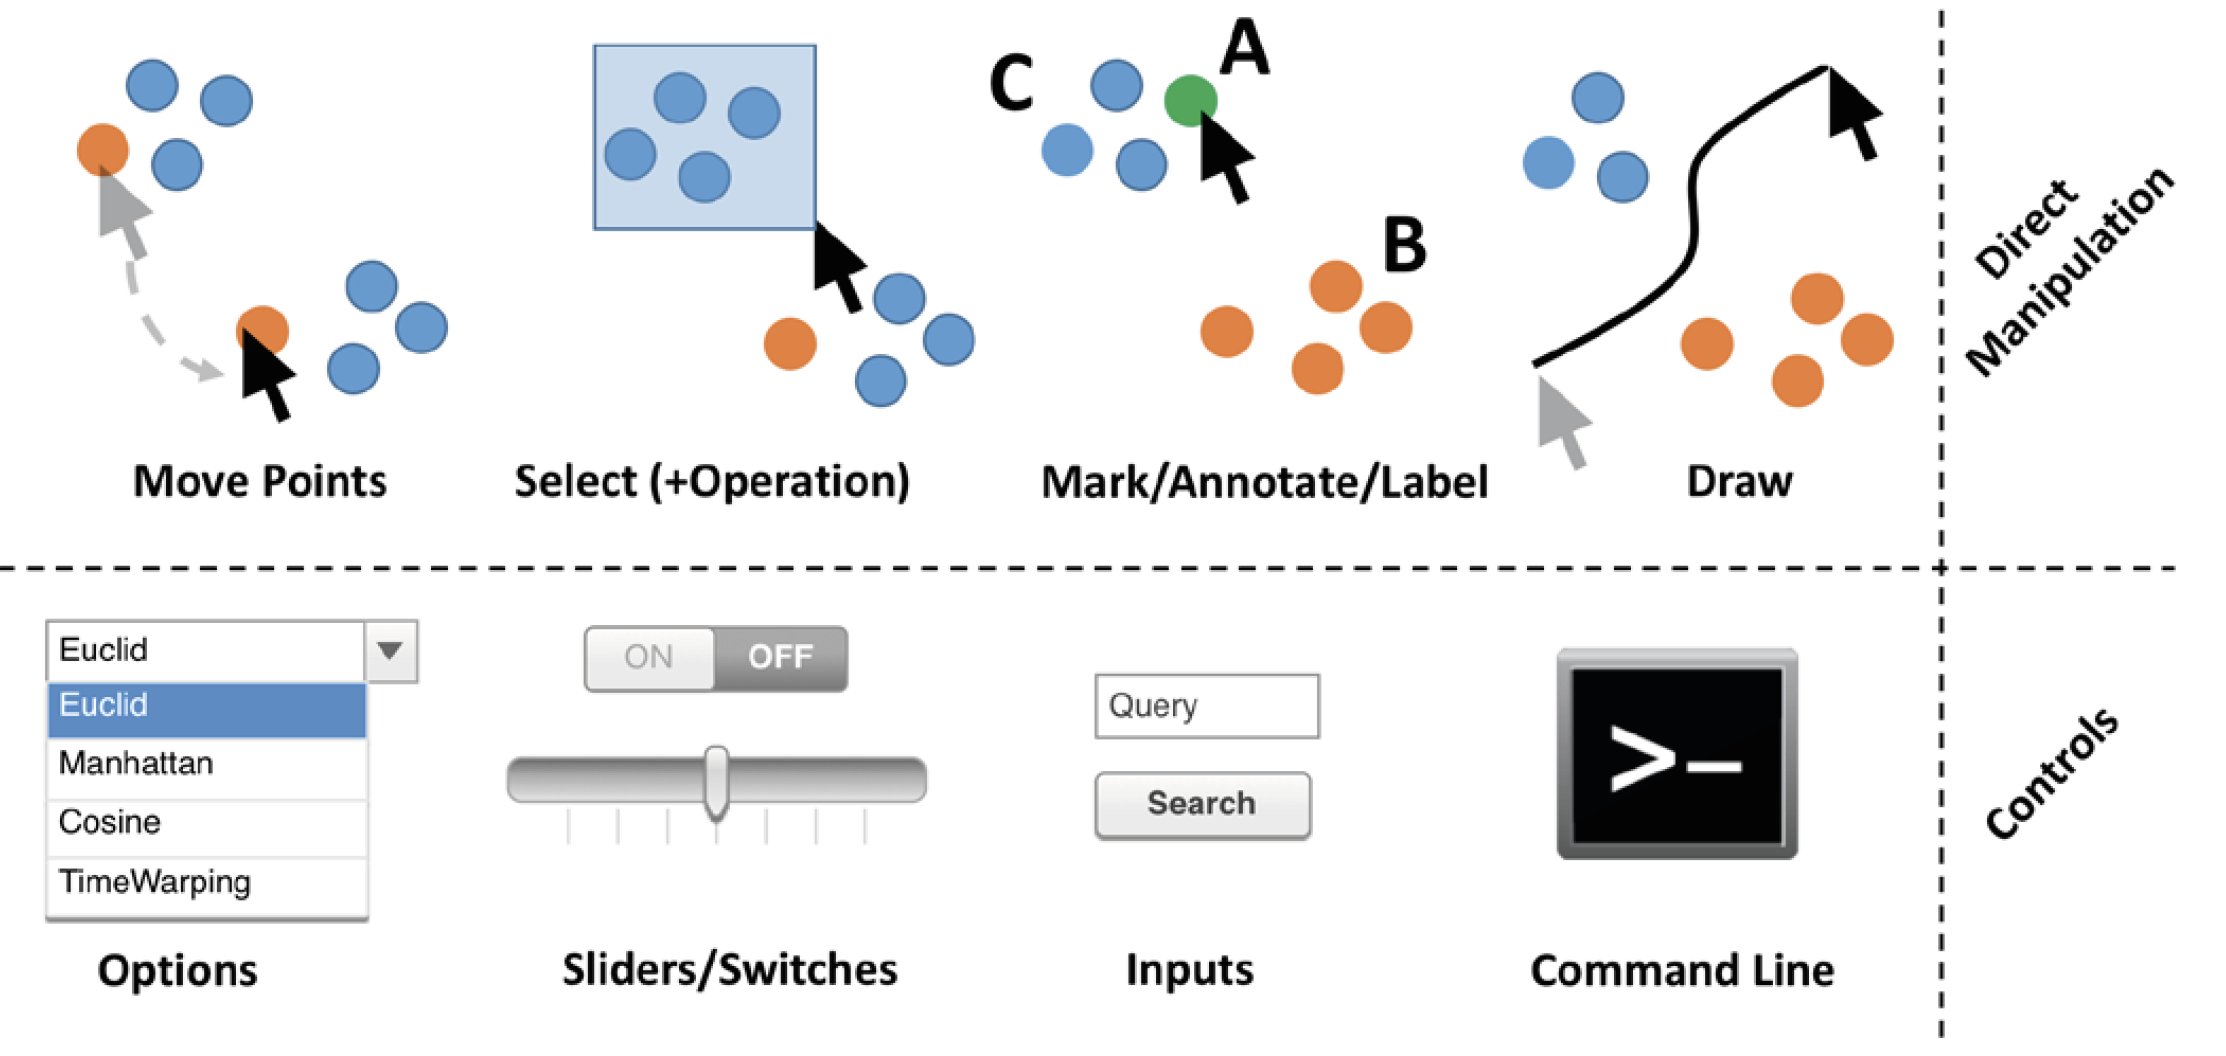
In most applications, users are expected to interact either directly with the visualization (selecting or marking points) or via external UI inputs. It’s also possible to have the interaction through external program controls or other more novel inputs (like speech, gestures, multitouch commands on tablets, …). Here is a breakdown of some example interaction strategies, originally from the _Visual Interaction with Dimensionality Reduction” survey paper.
-
Stepping back, it’s helpful to view visualization and data science algorithms holistically. In applications where interpretation and discovery are important, algorithms and interaction can work together to support complex reasoning.