Introduction to Reactivity
Viewing shiny code execution as a graph
-
These notes will explore the idea of reactivity in more depth. Recall that reactivity refers to the fact that Shiny app code is not run from top to bottom, like an ordinary R script. Instead, it runs reactively, depending on inputs that the user has provided. This can make writing Shiny code a bit unintuitive at first, but there are a few higher-level concepts that can help when writing reactive code.
-
The most important of these concepts is that reactive code can be viewed as a graph. The
uiandserverdefine an explicit dependency structure for how components depend on one another. Theinput$’s withinrender*functions in the server specify how UI inputs affect server computations. The IDs within the*Outputelements in theuispecify which of the renderedoutput$’s in the server should be used to populate the visible interface. -
For example, our first “Hello” app has the following (simple) reactivity graph. Note that I’ve drawn input and output nodes differently, to emphasize the flow of computation. I’ve also copied the code from the original app for reference.
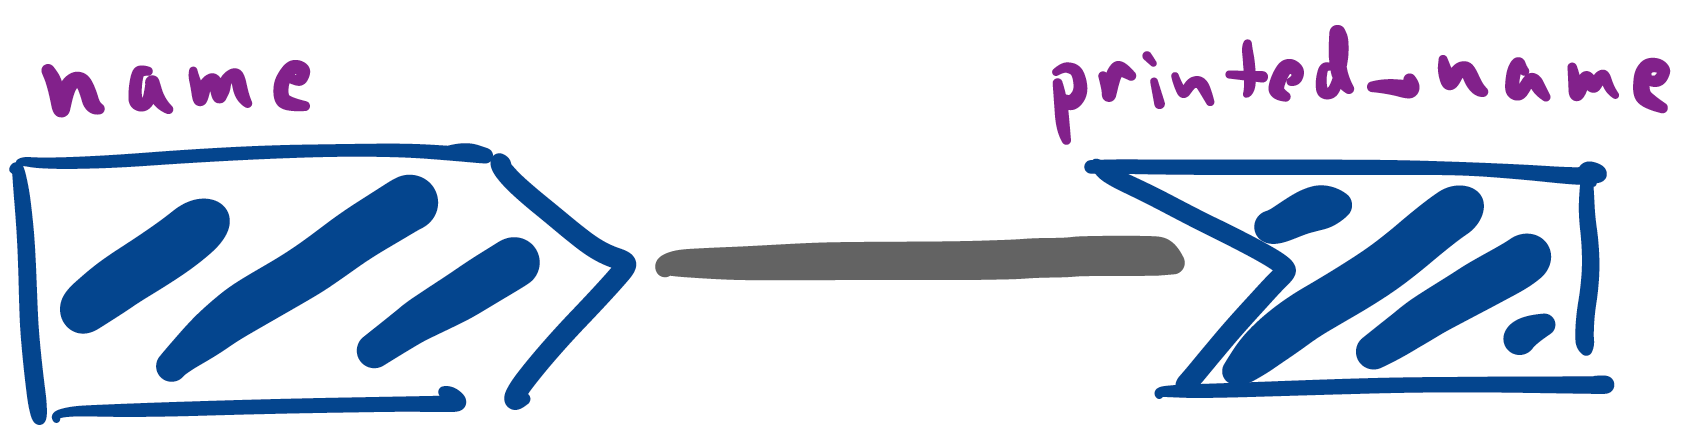
library(shiny) ui <- fluidPage( titlePanel("Hello!"), textInput("name", "Enter your name"), textOutput("printed_name") ) server <- function(input, output) { output$printed_name <- renderText({ paste0("Welcome to shiny, ", input$name, "!") }) } app <- shinyApp(ui, server) -
Even though the graph is simple, note that the outputs will be recomputed each time that the input is changed. For more general graphs, all downstream nodes will be re-executed whenever an upstream source is changed (typically by a user input, though it’s possible to trigger changes automatically).
-
Reactive expressions provide a special kind of node that live between inputs and outputs. They depend on inputs, and they feed into outputs, but they are never made directly visible to the user. This is why we’ve drawn them as a kind of special intermediate node. Below, I’ve drawn the graph for our random normal plotter, with the reactive
samples()expression.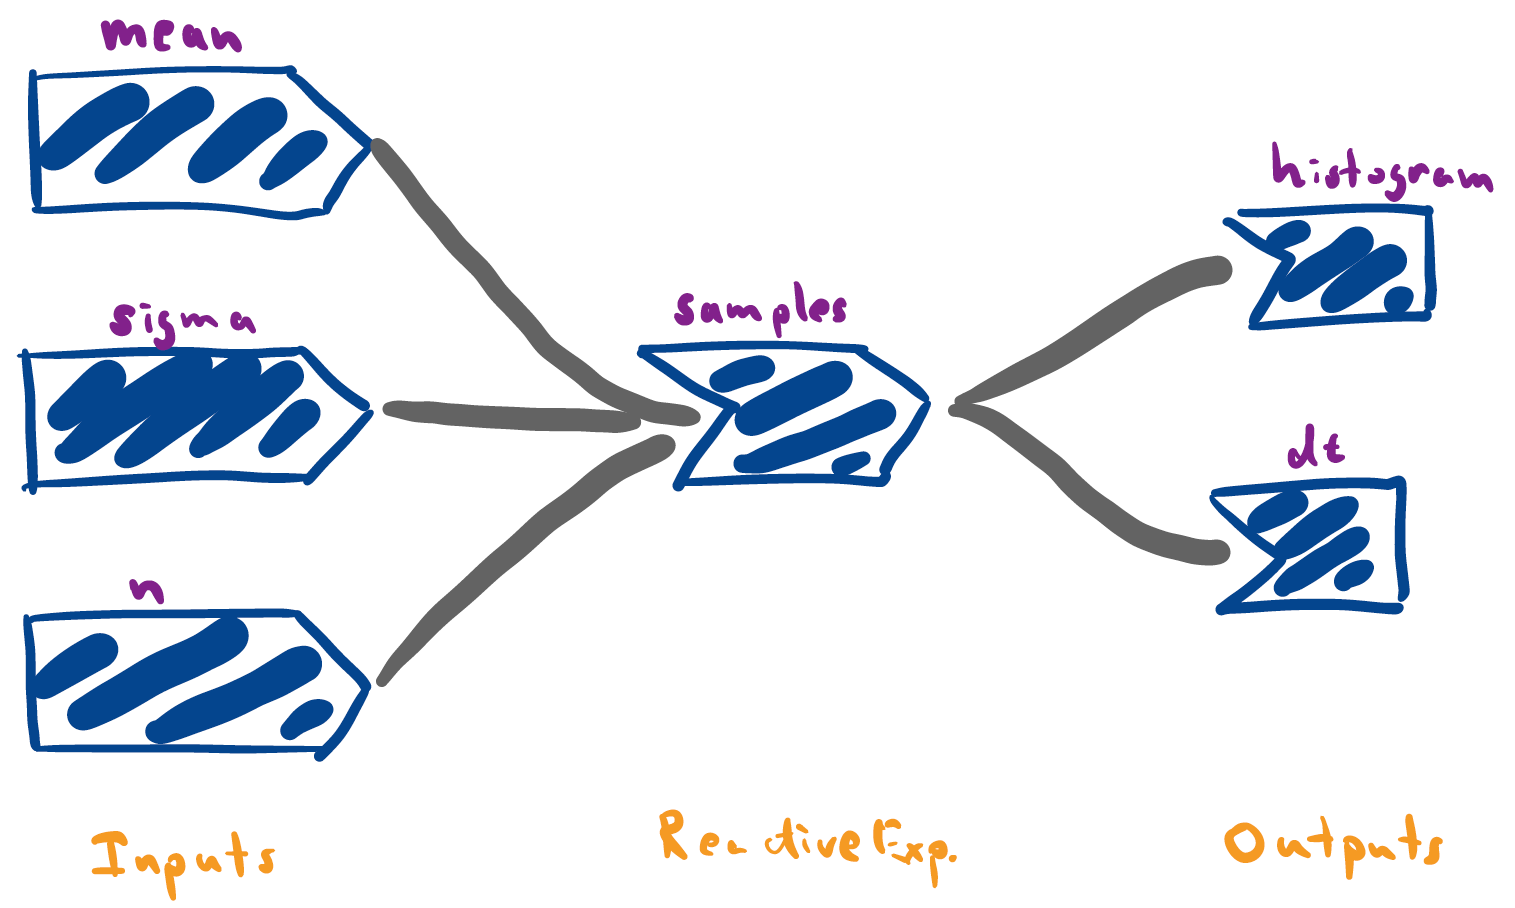
library(shiny) library(tidyverse) ### Functions within app components generate_data <- function(n, mean, sigma) { data.frame(values = rnorm(n, mean, sigma)) } histogram_fun <- function(df) { ggplot(df) + geom_histogram(aes(values), bins = 100) + xlim(-10, 10) } ### Defines the app ui <- fluidPage( titlePanel("Random Normals"), numericInput("mean", "Enter the mean", 0), sliderInput("n", "Enter the number of samples", 500, min=1, max=2000), sliderInput("sigma", "Enter the standard deviation", 1, min=.1, max=5), plotOutput("histogram"), dataTableOutput("dt") ) server <- function(input, output) { samples <- reactive({ generate_data(input$n, input$mean, input$sigma) }) output$histogram <- renderPlot(histogram_fun(samples())) output$dt <- renderDataTable(samples()) } app <- shinyApp(ui, server) -
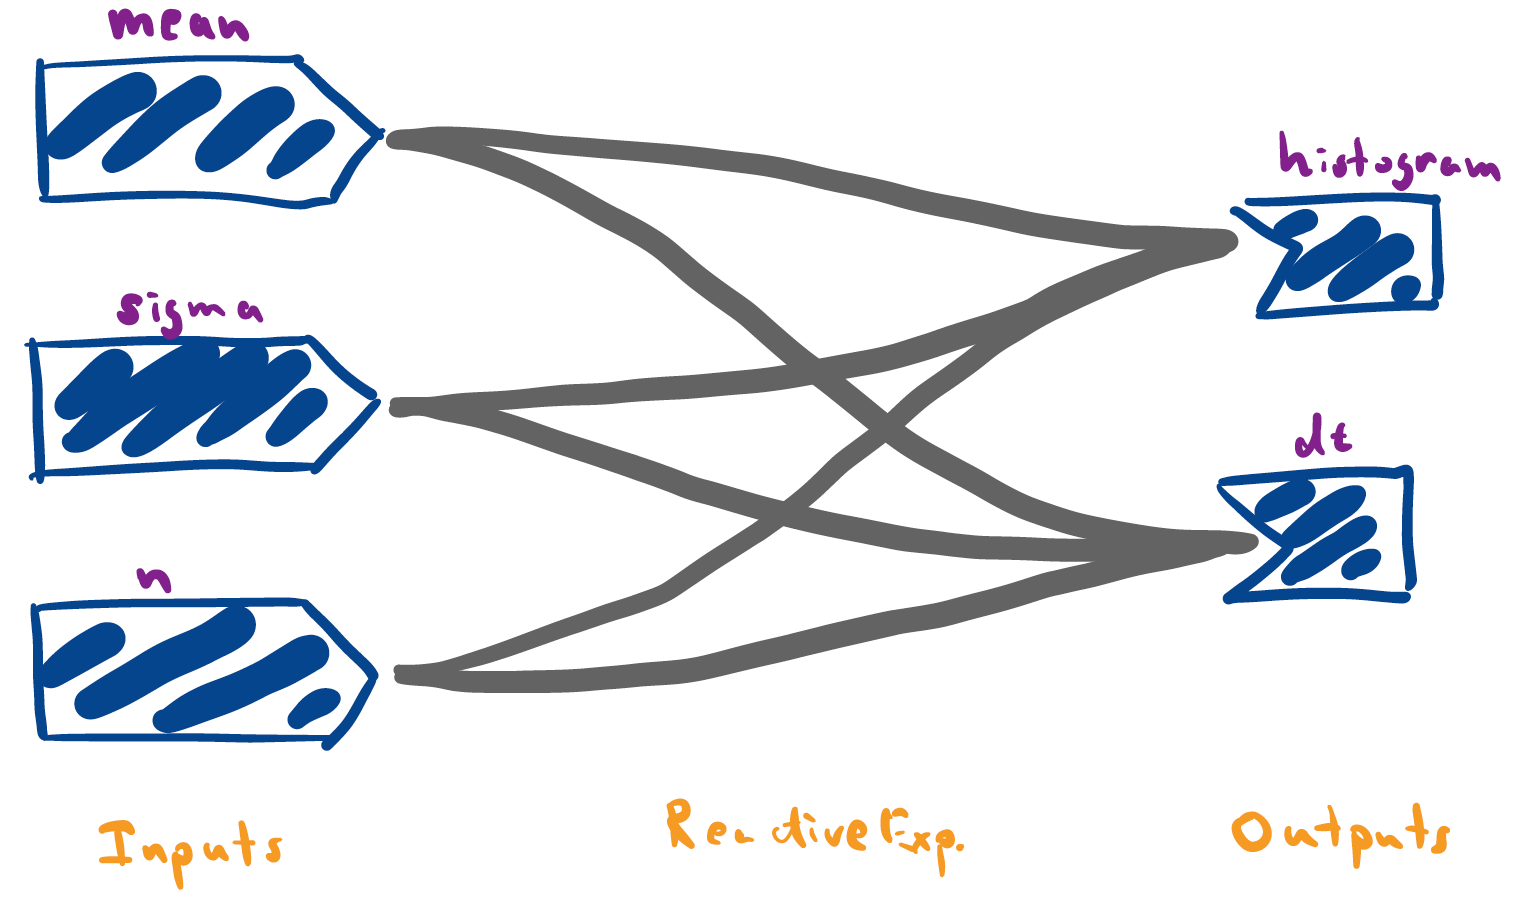
A useful perspective is to think of reactive expressions as simplifying the overall reactivity graph. Specifically, by adding a reactive node, it’s possible to trim away many edges. For example, our initial implementation of the random normal plotter (which didn’t use the reactive expression) has a much more complicated graph, since many inputs feed directly into outputs.
-
Let’s see these principles in action for a similar, but more complex app. The app below can be used for power analysis. It simulates two groups of samples, both from normal distributions, but with different (user specified) means. We’ve used a reactive expression to generate the samples, so that both the histogram and hypothesis test result outputs can refer to the same intermediate simulated data.
library(shiny)
library(tidyverse)
library(broom)

### Functions within app components
generate_data <- function(n, mean1, mean2, sigma) {
  data.frame(
    values = c(rnorm(n, mean1, sigma), rnorm(n, mean2, sigma)),
    group = rep(c("A", "B"), each = n)
  )
}

histogram_fun <- function(df) {
  ggplot(df) +
    geom_histogram(
      aes(values, fill = group),
      bins = 100, position = "identity",
      alpha = 0.8
    ) +
    xlim(-10, 10)
}

test_fun <- function(df) {
  t.test(values ~ group, data = df) %>%
    tidy() %>%
    select(p.value, conf.low, conf.high)
}

### Defines the app
ui <- fluidPage(
  sidebarLayout(
    sidebarPanel(
      sliderInput("mean1", "Mean (Group 1)", 0, min = -10.0, max = 10.0, step = 0.1),
      sliderInput("mean2", "Mean (Group 2)", 0, min = -10, max = 10, step = 0.1),
      sliderInput("sigma", "Enter the standard deviation", 1, min=.1, max=5),
      sliderInput("n", "Enter the number of samples", 500, min=1, max=2000),
    ),
    mainPanel(
      plotOutput("histogram"),
      dataTableOutput("test_result")
    )
  )
)

server <- function(input, output) {
  samples <- reactive({
    generate_data(input$n, input$mean1, input$mean2, input$sigma)
  })
  output$histogram <- renderPlot(histogram_fun(generate_data(input$n, input$mean1, input$mean2, input$sigma)))
  output$test_result <- renderDataTable(test_fun(generate_data(input$n, input$mean1, input$mean2, input$sigma)))
}

app <- shinyApp(ui, server)
Other than that, the only difference is that I’ve saved output from the
t.testusingtest_result. Notice the use of thebroompackage, which helps format the test output into adata.frame. -
So far, all of our reactive code has lived within the
render*orreactive()sets of functions. However, there is a another kind that is often useful, especially in more advanced applications:observers. An observer is a computation that is done every time certain inputs are changed, but which don’t affect downstream UI outputs through arender*function. For example, below, we’ve added a block (underobserveEvent) that prints to the console every time either of the means are changed. I realize it is a bit of a mystery why these functions would ever be useful, but we will see them in more realistic contexts next week.library(shiny) library(tidyverse) library(broom) ### Functions within app components generate_data <- function(n, mean1, mean2, sigma) { data.frame( values = c(rnorm(n, mean1, sigma), rnorm(n, mean2, sigma)), group = rep(c("A", "B"), each = n) ) } histogram_fun <- function(df) { ggplot(df) + geom_histogram( aes(values, fill = group), bins = 100, position = "identity", alpha = 0.8 ) + xlim(-10, 10) } test_fun <- function(df) { t.test(values ~ group, data = df) %>% tidy() %>% select(p.value, conf.low, conf.high) } ### Defines the app ui <- fluidPage( sidebarLayout( sidebarPanel( sliderInput("mean1", "Mean (Group 1)", 0, min = -10.0, max = 10.0, step = 0.1), sliderInput("mean2", "Mean (Group 2)", 0, min = -10, max = 10, step = 0.1), sliderInput("sigma", "Enter the standard deviation", 1, min=.1, max=5), sliderInput("n", "Enter the number of samples", 500, min=1, max=2000), ), mainPanel( plotOutput("histogram"), dataTableOutput("test_result") ) ) ) server <- function(input, output) { samples <- reactive({ generate_data(input$n, input$mean1, input$mean2, input$sigma) }) output$histogram <- renderPlot(histogram_fun(samples())) output$test_result <- renderDataTable(test_fun(samples())) observeEvent(input$mean1 | input$mean2, { message("group 1 mean is now: ", input$mean1) message("group 2 mean is now: ", input$mean2) }) } app <- shinyApp(ui, server)