Visualization Portfolio - STAT 479 Spring 2022
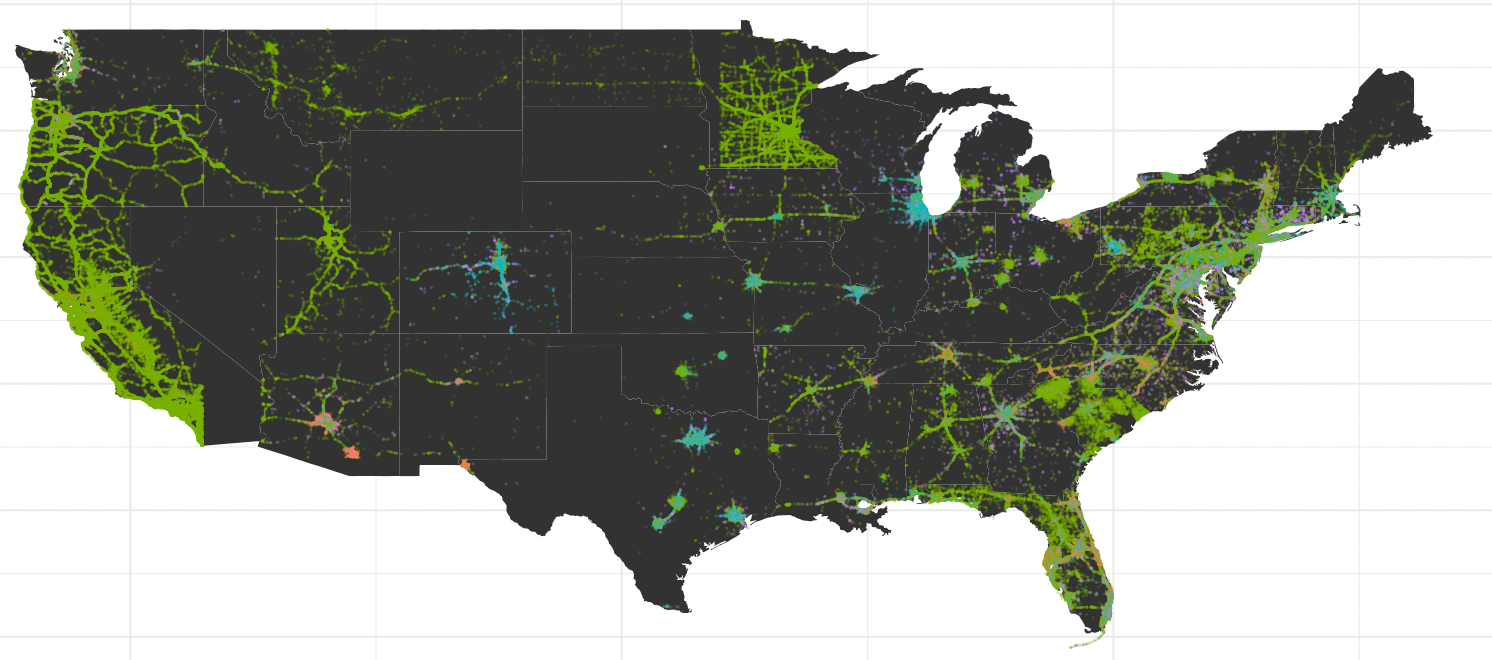
Traffic Accidents in United States
Author: Chenying Mi
Click here to visit the interactive app.
The aim of this portfolio project is to find and compare traffic accidents between states in 2020. There are five visualizations in total including boxplot, US maps, line plot, and bar plot. Each graph can provide opportunity for audience to compare accident situation in different aspects.