Visualization Portfolio - STAT 479 Spring 2022

Augsburg Landcover Classification
Author: Zhihao Lyu
Click here to visit the interactive app.
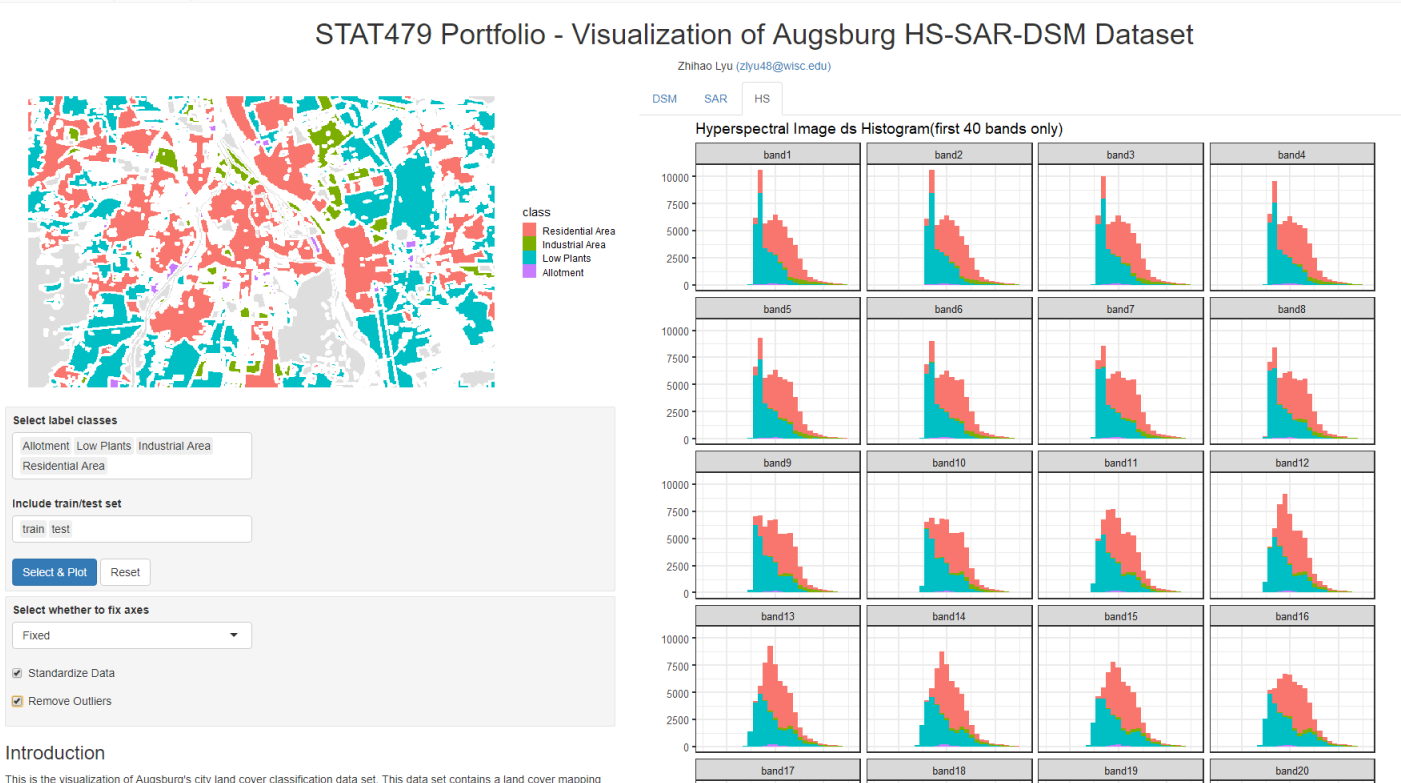
This is the visualization of Augsburg’s city land cover classification data set, which contains a land cover mapping and multi-modal remote sensing data, which includes 180 bands Hyper-Spectral(HS) image, 4 bands Synthetic Aperture Radar(SAR) data, and a Digital Surface Model(DSM). You can - brush the land mapping, or select classes and train/test set - click “Select & Plot” button, the plots will be re-rendered with the corresponding pixels highlighted; click “Reset” all samples will be diselected. - choose wether to fix x/y axis of the histograms; choose whether standardize the data and remove outliers.