Visualization Portfolio - STAT 479 Spring 2022
Close Contact Index during the COVID-19 Pandemic
Author: Wen Ye
Read the portfolio by clicking here.
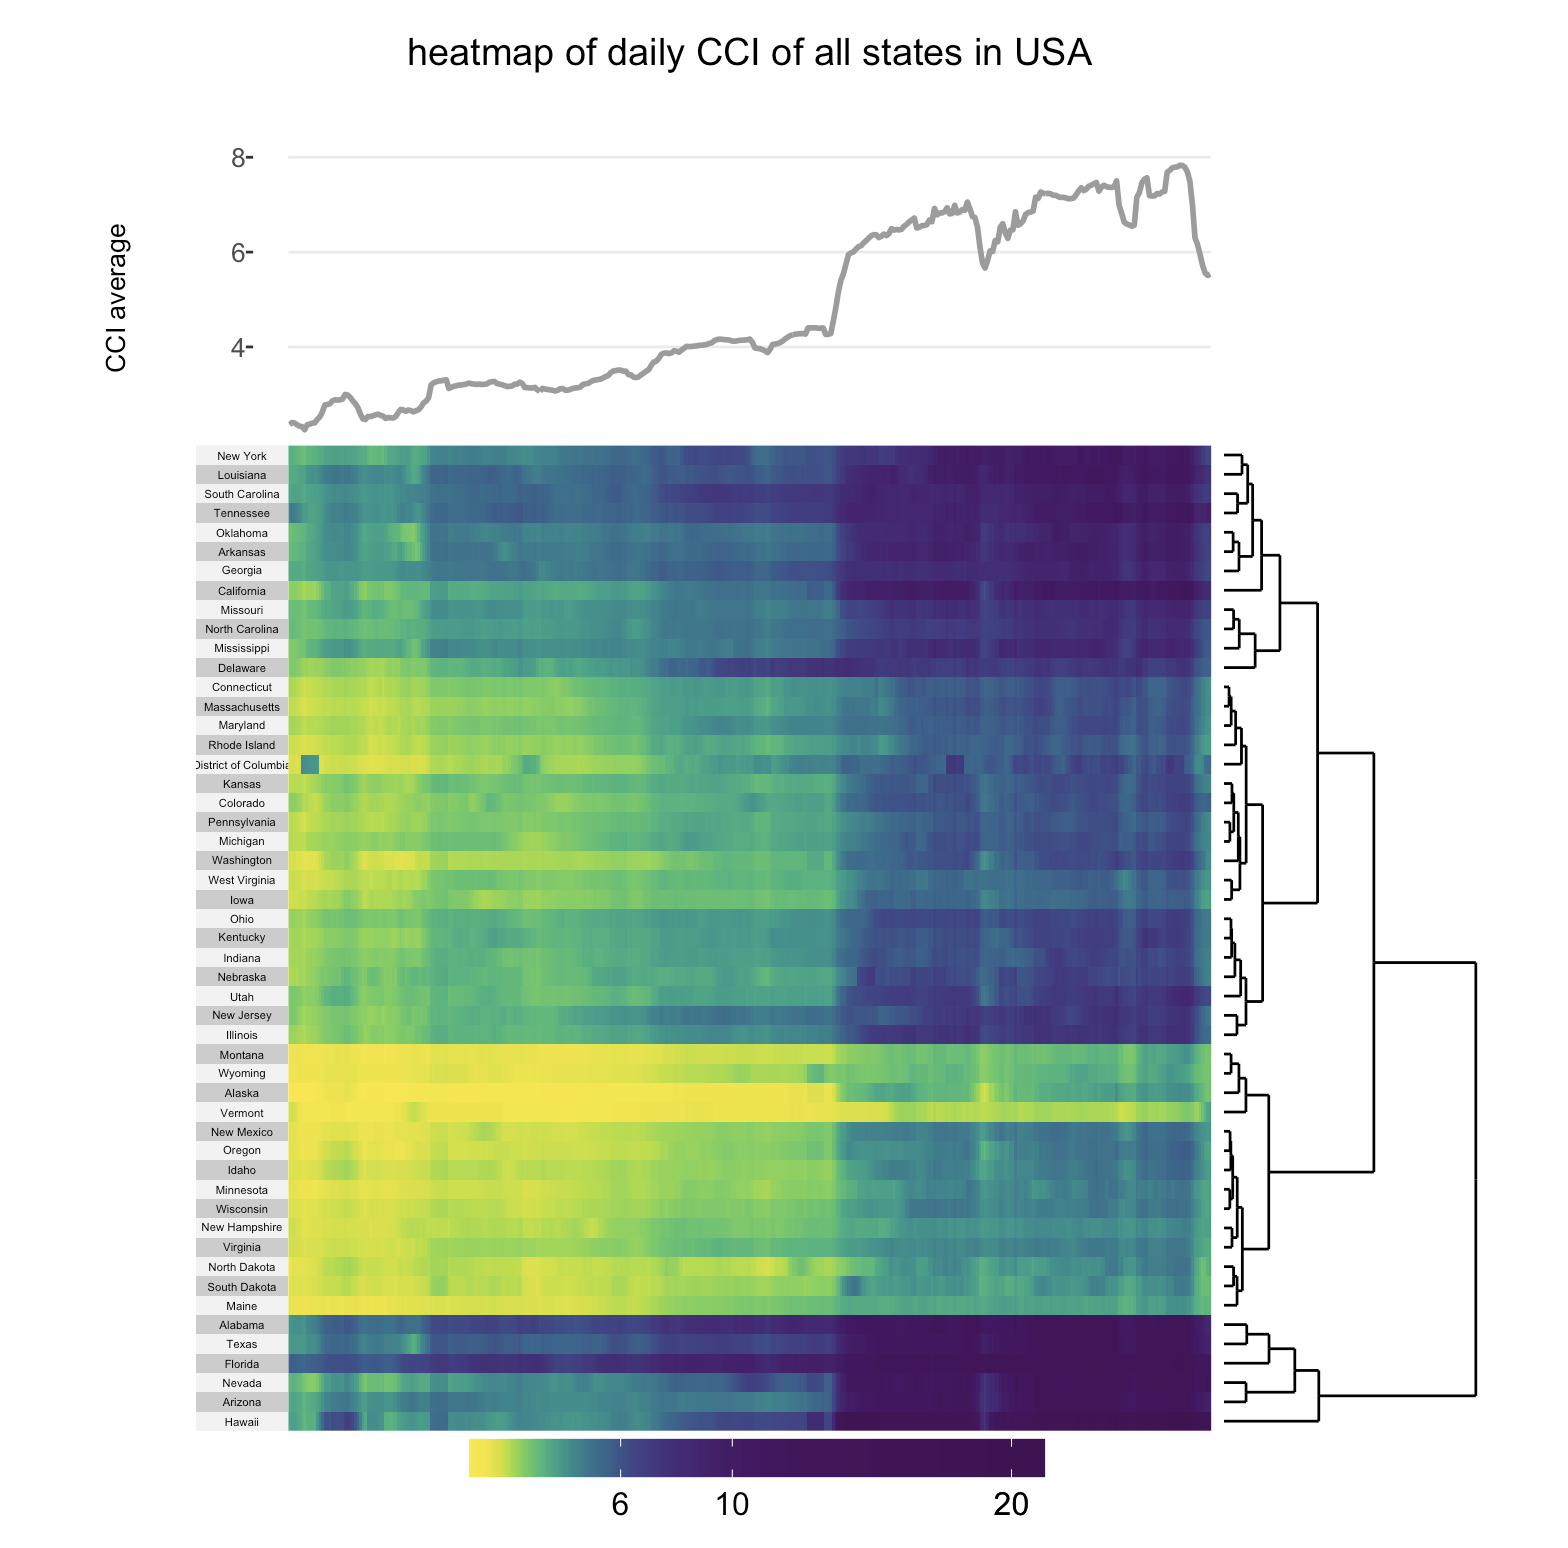
The visualizations aim to explore how the interaction between people changed throughout the year of 2021 in terms of their social distance in the United States. The interaction between people is quantified by the Close Contact Index(CCI) which measures if two or more devices come within 50 feet of each other within a five minute time period.