Visualization Portfolio - STAT 479 Spring 2022
Elections and COVID-19
Author: Kevin Hutchins
Click here to visit the interactive app.
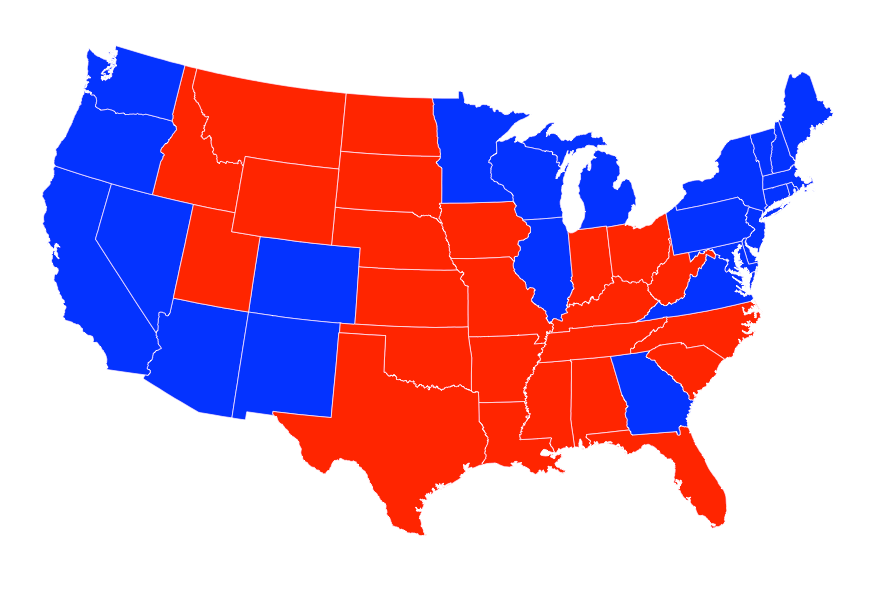
This project examines the relationship between election results and the impact of Covid-19. In particular, it examines how many people in each state became infected or died due to Covid-19, and compared that to the state’s outcome in the 2020 election. It features an interactive graph to watch the Covid-19 disease spread over the country over a two year period.