Visualization Portfolio - STAT 479 Spring 2022
Global COVID Cases
Author: Ruochong Fan
Click here to visit the interactive app.
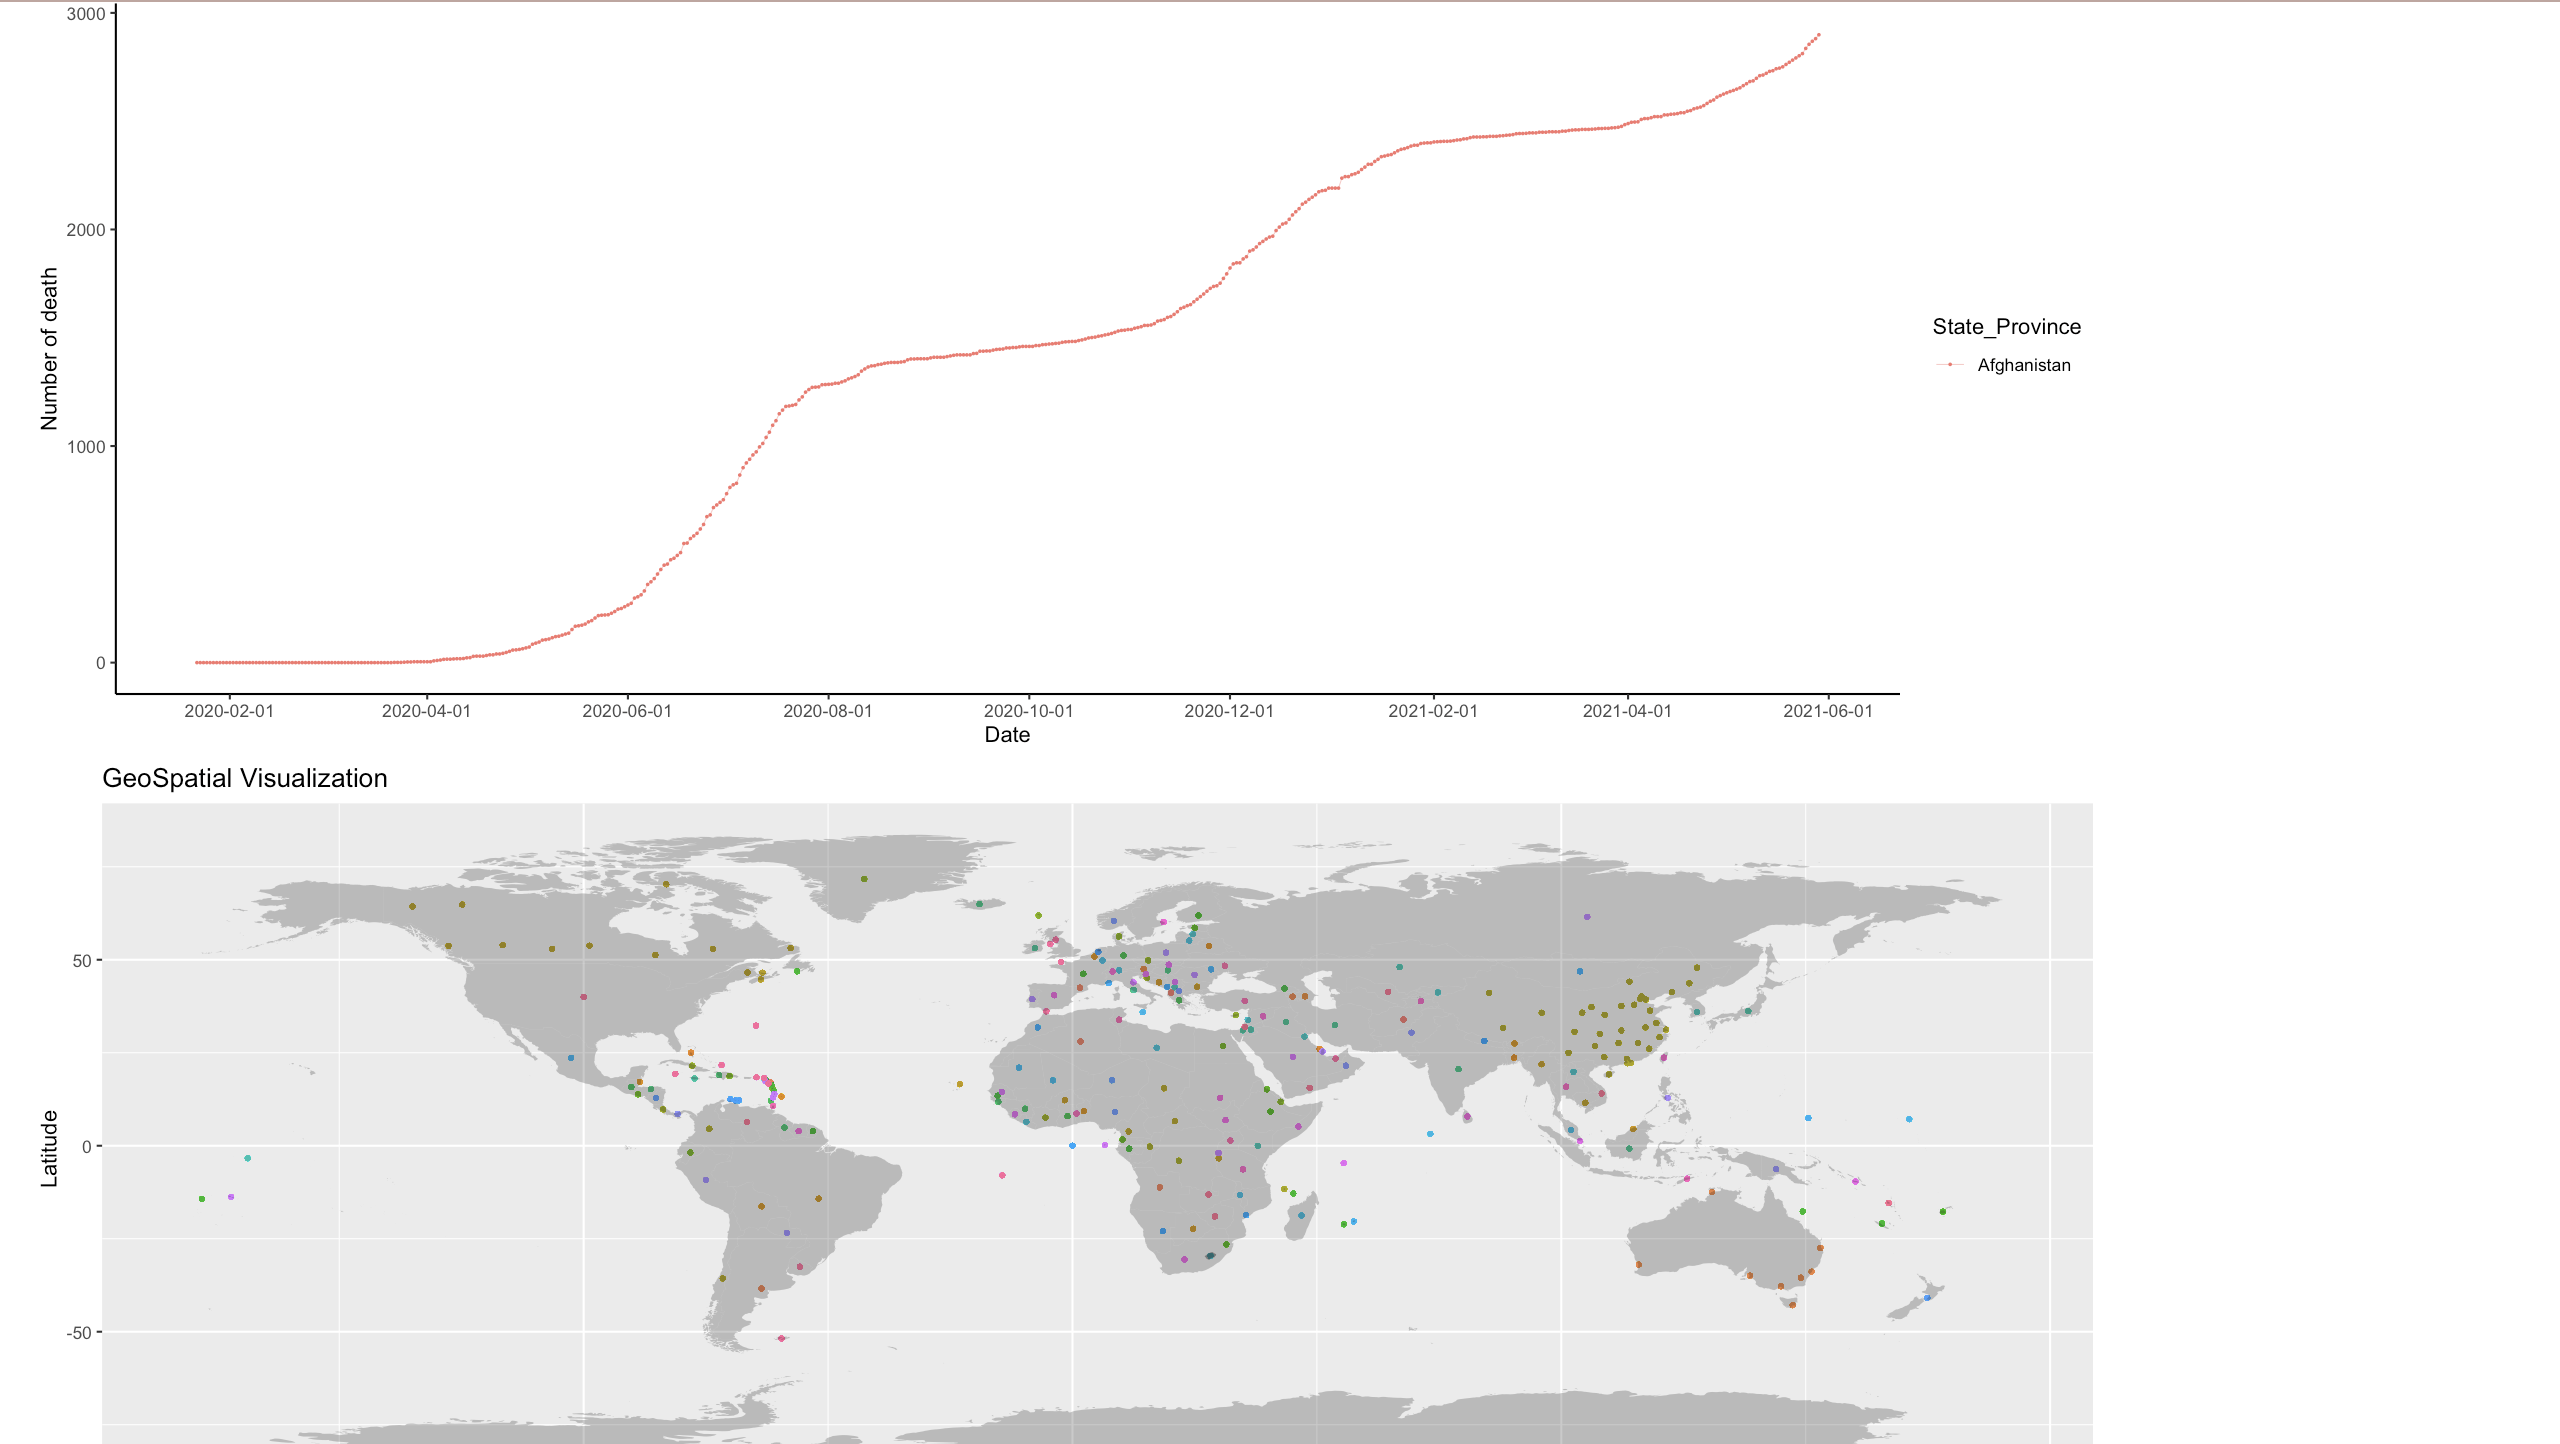
This project plots geographic COVID deaths in the world and colors by state. The time series plot presents the daily deaths of the chosen country. The barplot shows a country’s sum of death from Jan 22, 2020 to May 29, 2021.