Visualization Portfolio - STAT 479 Spring 2022

Seasonal Trends in Social Media Stocks (2012-2022)
Author: Hailey Park
Click here to visit the interactive app.
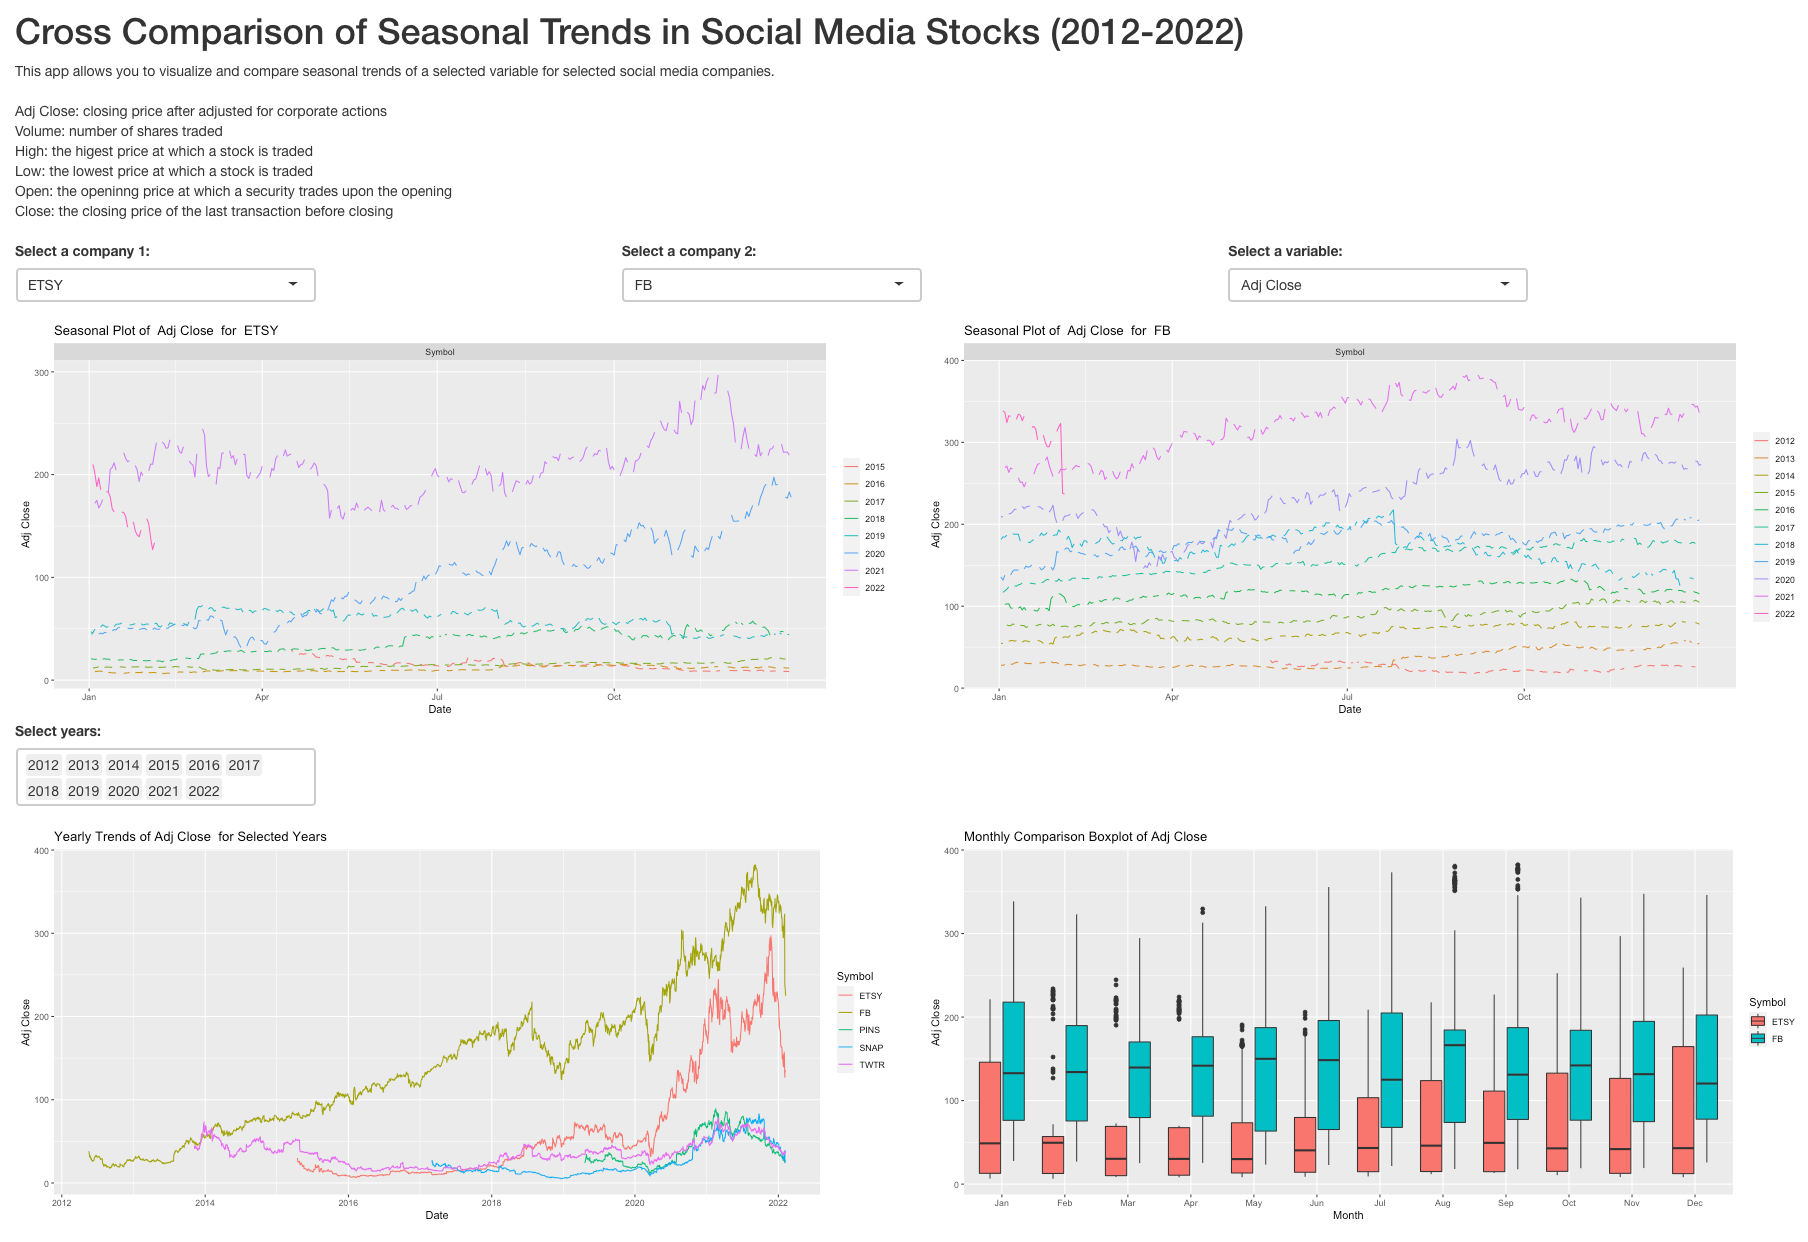
This application allows users to compare seasonal trends in major social media stocks from 2012 to 2022. Users can select two social media companies whose stocks they’re interested in exploring and a variable that will be mapped on the y-axis. Users can also filter years they’re interested in based on which the line graph of yearly trend and the boxplot of monthly trends will be drawn.