Visualization Portfolio - STAT 479 Spring 2022

Student Math Grades
Author: Zhongxuan Sun
Read the portfolio by clicking here.
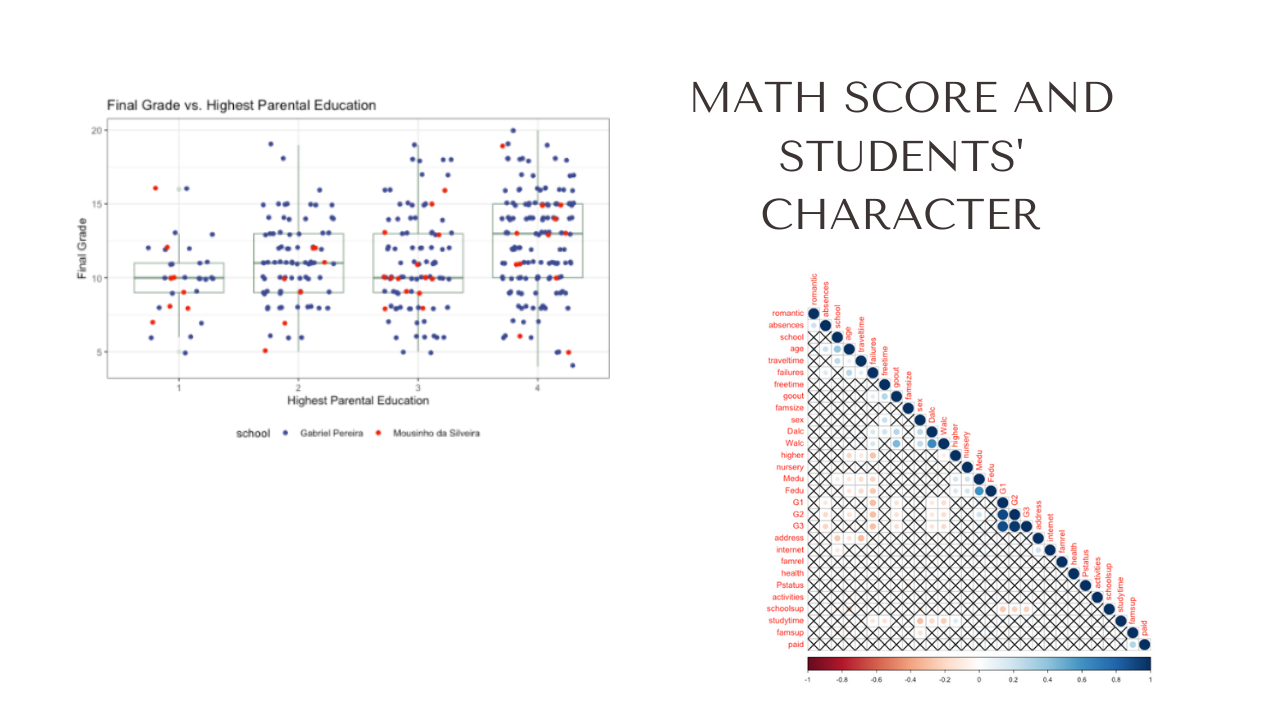
The two visualizations show the relationship between the students’ background, characteristics, and math grades. It contains a scatter + box plot and a correlation plot displaying the significant correlations at a level of 0.05.