Visualization Portfolio - STAT 479 Spring 2022
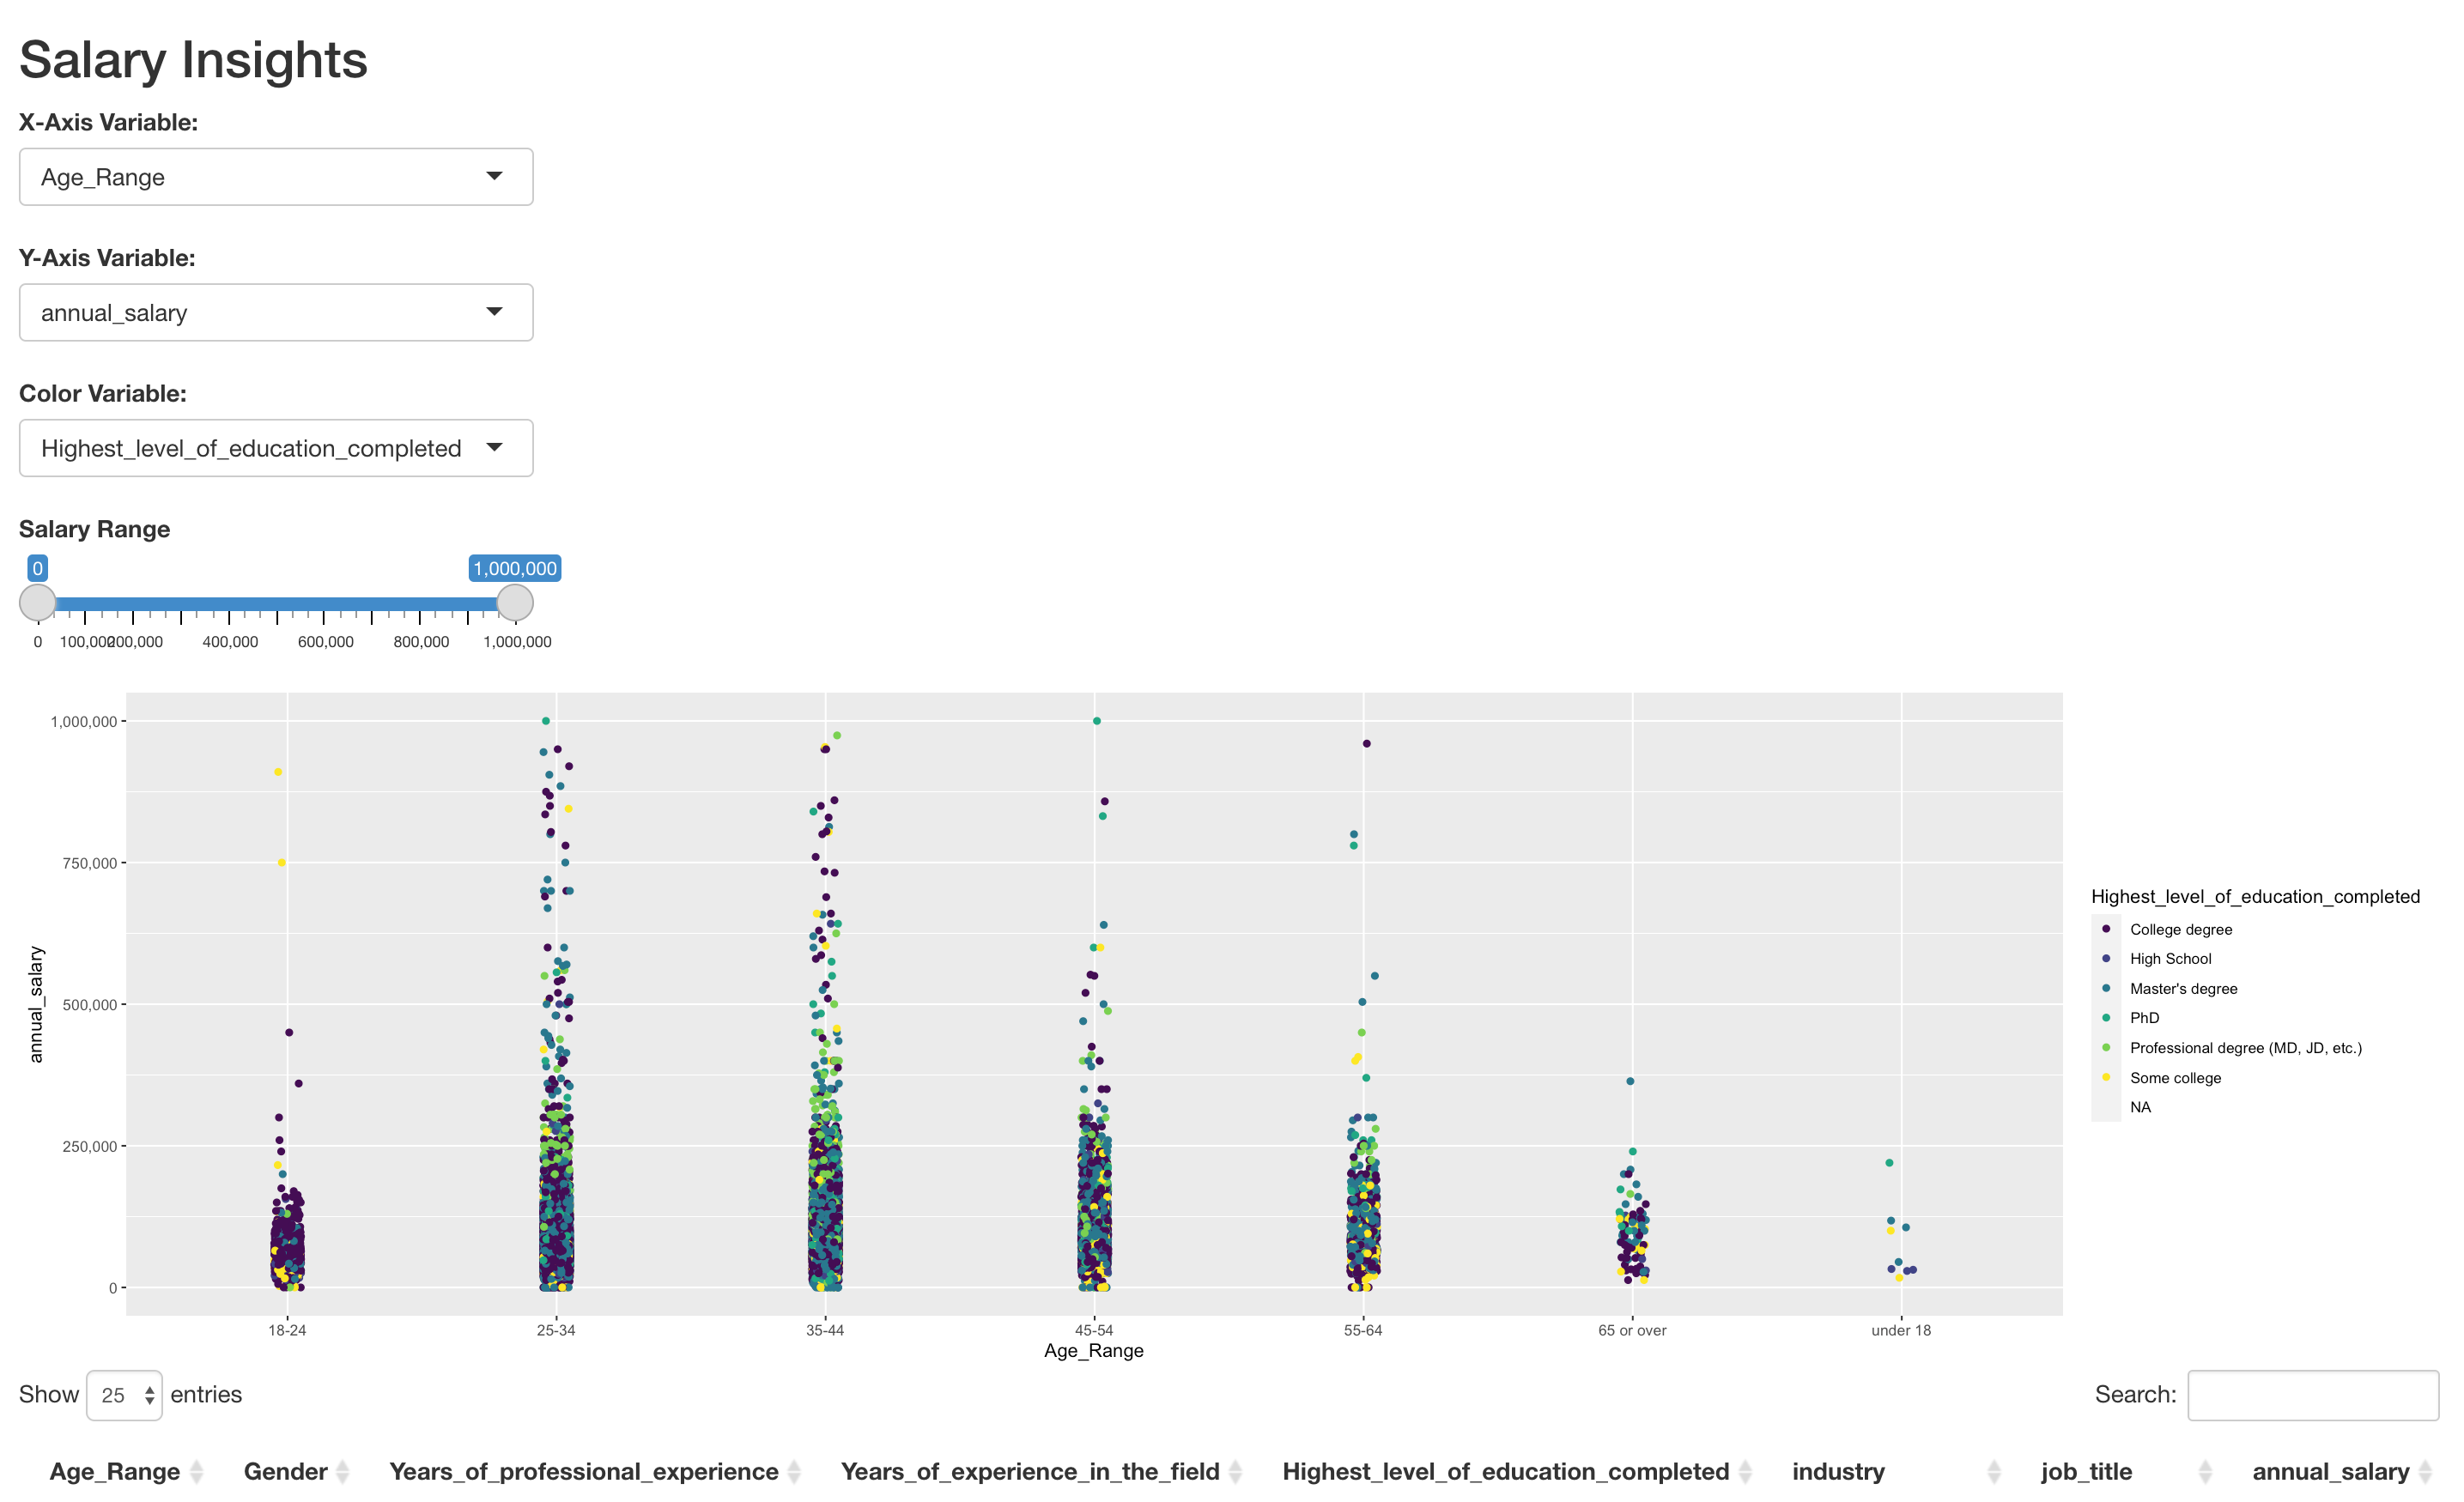
Salary Insights
Author: Peter Kennedy
Click here to visit the interactive app.
On this Shiny App, users can explore different factors that affect annual salary - such as gender, number of years in industry, highest level of education, and more - using an interactive scatterplot. The user is also accompanied by a data frame that where they can explore the data in a tabular fashion to get more insights.