Visualization Portfolio - STAT 479 Spring 2022

200 Popular Artists
Author: Varsha Bhandari
Read the portfolio by clicking here.
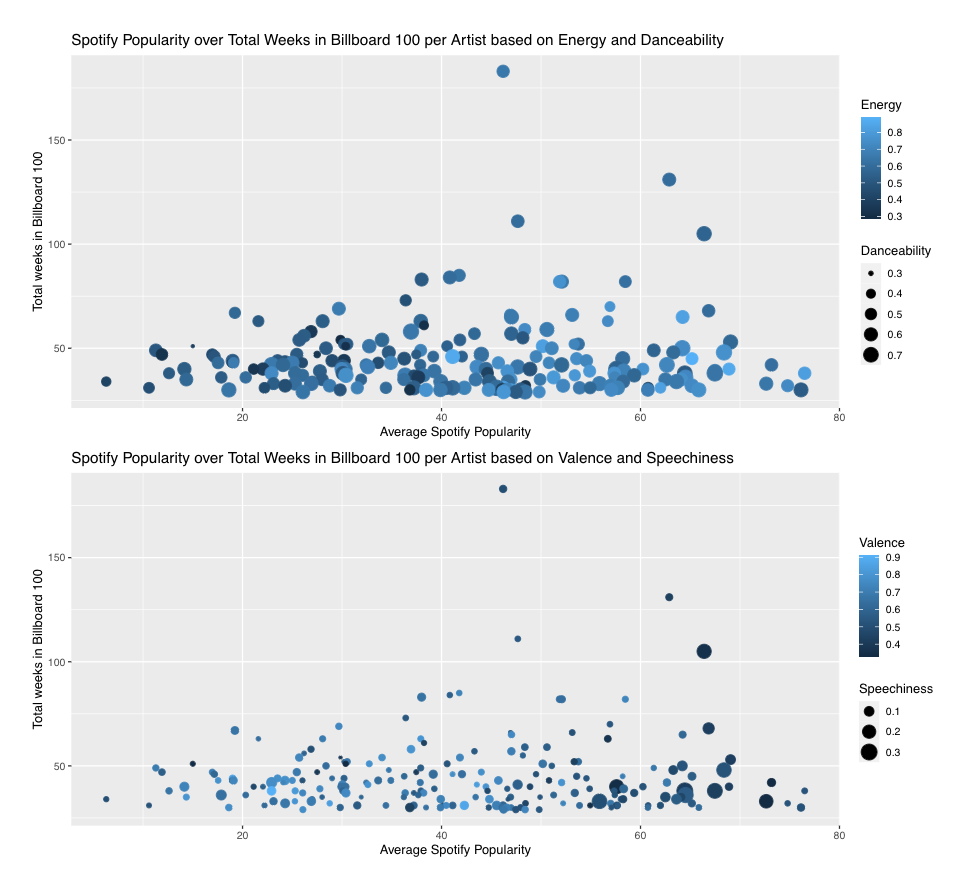
This visualization presents the top 200 most popular artists, based on Billboard’s top 100, in a scatter plot of spotify popularity and the most number of weeks spent in Billboard’s top 100. The first scatter plot gives insight into the artists’ energy (fast/loud tracks score higher energy value) and danceability (0 being least danceable/groovy) in their overall music. The second scatter plot presents information about the artists’ valence (low valence being sad or negative) and speechiness (.3 being more rap and low value being close to instrumental music) in their overall music.